

March 24, 2021
To the Shareholders of Cincinnati Financial Corporation:
You are cordially invited to virtually attend the Annual Meeting of Shareholders of Cincinnati Financial Corporation, which will take place at 9:30 a.m. on Saturday, April 27, 2019,May 8, 2021. To attend the virtual meeting, you may register at the Cincinnati Art Museum, located in Eden Park, Cincinnati, Ohio.http://viewproxy.com/cinfin/2021. The business to be conducted at the meeting includes:
1.Electing 14 directors for one-year terms;
2.Voting on a nonbinding proposal to approve compensation for the company’s named executive officers;
3.Ratifying the selection of Deloitte & Touche LLP as the company’s independent registered public accounting firm for 2021;
4.Transacting such other business as may properly come before the meeting.
Shareholders of record at the close of business on February 28, 2019,March 10, 2021, are entitled to vote at the meeting.
Whether or not you plan to register for and virtually attend the meeting, please cast your vote as promptly as possible. We encourage convenient online voting, which saves you and your company significant postage and processing costs. If you prefer, you may submit your vote by telephone or by mail. Detailed voting instructions can be found in the Frequently Asked Questions section on Page 72 of this proxy statement.
Thank you for your interest and participation in the affairs of the company.
/S/ Lisa A. Love
Lisa A. Love, Esq.
Senior Vice President, General Counsel and Corporate Secretary
This proxy statement, the Annual Report on Form 10-K, the 2021 Annual Letter from the Chairman and the Chief Executive Officerto Shareholders and voting instructions were first made available to Cincinnati Financial Corporation shareholders on March 13, 2019.
24, 2021.
Table of Contents
| Proxy Summary | ||||||
| Voting Matters and Board Recommendations | ||||||
| Our Governance Practices | ||||||
| Director Nominees | ||||||
| Security Ownership of Principal Shareholders and Management | ||||||
| Delinquent Section 16(a) | Reports | |||||
| Information About the Board of Directors | ||||||
| Proposal 1 - Election of Directors | ||||||
| Nominees for Directors for Terms of | Office Continuing until 2022 | |||||
| Compensation of | ||||||
| Governance of Your Company | ||||||
| Governance Policies and Practices | ||||||
| Certain Relationships and Transactions | ||||||
| Compensation of Named Executive Officers and Directors | ||||||
| Proposal 2 - Say-on-Pay: Advisory Vote on Compensation of Named Executive Officers | ||||||
| Report of the Compensation Committee | ||||||
| Compensation Committee Interlocks and Insider Participation | ||||||
| Compensation Discussion and Analysis | ||||||
| Audit-Related Matters | ||||||
| Proposal 3 - Ratifying the Selection of the Independent Registered Public Accounting Firm | ||||||
| Report of the Audit Committee | ||||||
| Fees Billed by the Independent Registered Public Accounting Firm | ||||||
| Services Provided by the Independent Registered Public Accounting Firm | ||||||
| Frequently Asked Questions | ||||||
| Conclusion | ||||||
| Shareholder Proposals, Director Nominations and Important Dates | ||||||
| Cost of Solicitation | ||||||
| Other Business | ||||||
Appendix Comparable GAAP Measures | ||||||
Page 2
Proxy Summary
This summary highlights information contained elsewhere in this proxy statement. It does not contain all of the information that you should consider before voting. Please read the entire proxy statement, and for more complete information about the company’s 20182020 performance, please review the company’s 20182020 Annual Report on Form 10-K.
Date and Time: April 27, 2019,May 8, 2021, 9:30 a.m. ET
Location: Register at http://viewproxy.com/cinfin/2021
(Shareholder control number required)
Record Date: February 28, 2019March 10, 2021
Voting Matters and Board Recommendations
| Our Board’s Recommendation | |||||
Election of Directors (Page | FOR Each Director Nominee | ||||
Advisory Vote to Approve Executive Compensation (Page | FOR | ||||
Ratification of Auditors (Page 68) | FOR | ||||
Page 3
Two directors were added to the board in 2020, as the board continued its refreshment efforts and prepared for the departure of one director who is not standing for re-election at the 2021 Annual Meeting of Shareholders. With the addition of Nancy C. Benacci and Charles O. Schiff, the board was comprised of 15 directors, of which 73% are independent and four are women, one of whom is African American. The two directors added in 2020 provided new and added to skills the board deemed important. Following the 2021 Annual Meeting of Shareholders, 11 of 14 directors will be independent; with five of the independent directors having tenure of 10 years or less and six having tenure of greater than 10 years.
Enhanced Environmental, Social and Governance (ESG) Disclosure
With the oversight of the nominating committee, in 2020 the company continued to followenhance its strongannual ESG disclosures, “Environmental, Social and Governance Report,” “Sustainability Disclosure Using SASB Standards for the Insurance Industry” and the “Sustainability Data Sheet.” Collectively, these publications organize and enhance our existing disclosures about ESG topics such as our commitment to the development and financial wellness of our workforce, including disclosure of our adjusted pay gap for women and minorities; our commitment to managing climate risk; and our commitment to ethical governance policies and practices to benefit shareholders. Highlights included:operations. You can find more information about these disclosures at cinfin.com/sustainability.
Our Governance Practices
Cincinnati Financial is committed to strong corporate governance. It keeps abreastWe believe that strong governance builds trust and promotes the long-term interests of developingour shareholders. Highlights of our corporate governance practices include the following:
Board Governance Practices
•Strong board oversight of enterprise risk.
•Over 75% of our directors are expected to be independent following the 2021 shareholder meeting.
•Our audit, compensation and adopts those that it believesnominating committees are appropriatefully independent.
•Strong independent lead director with clearly defined role and responsibilities.
•Robust stock ownership guidelines for our company and its shareholders. In 2018, shareholders approved an amendment to the company's directors at 5 times annual cash meeting fees.
•Code of RegulationsConduct applicable to allow proxy access for director nominations.directors, officers and company associates.
•Annual board and committee self-assessments.
•Regular executive sessions of the non-employee directors at onethe board and committee level.
•High degree of its regular meetings.board interaction with management to ensure successful oversight and succession planning.
•Mandatory retirement age.
Shareholder Rights
•All directors are elected annually with a simple majority standard for all uncontested director elections and by plurality in contested director elections.
•No poison pill.
•Shareholders have the right to call a special meeting.
Page 4
•Regular engagement with shareholders to understand their perspectives and concerns on a broad array of topics, including corporate governance, executive compensation and sustainability matters.
•Responsive to shareholder feedback.
•Proxy access for director nominees, enabling a shareholder, or group of up to 20 shareholders holding 3% of the company's common shares for at least three years, to nominate candidates for the greater of two seats or 20% of the board nominees.
Compensation Governance
•Pay program tied to performance.
•Majority of pay is long-term and at-risk with no guaranteed bonuses or salary increases.
•Robust stock ownership guidelines of 5 times salary for the chief executive officer and 3.5 times salary for the other named executive officers.
•Prohibition on all hedging of Cincinnati Financial securities by directors and officers.
•No tax gross-up payments to executives.
•Annual advisory approval of executive compensation program.
•Compensation clawback provisions included in shareholder approved compensation plans.
•Double-trigger required for vesting of plan-based compensation in the event of a change in control.
Page 5
Director Nominees
The following table provides summary information about each director nominee. Complete information about each director’s background and experience begins on Page 12. Each director stands for election annually.
| Name | Age | Primary Occupation | Independent | Committee Memberships | Other Public Company Boards | Name | Age | Primary Occupation | Independent | Committee Memberships | Other Public Company Boards | |||||||||||
| Thomas J. Aaron | Thomas J. Aaron | 59 | Executive Vice President and Chief Financial Officer (Retired), Community Health Systems Inc. | ü | A | 0 | ||||||||||||||||
| William F. Bahl* | 67 | Chairman, Bahl & Gaynor Investment Counsel Inc. | ü | A, E, I, N (Chair) | 0 | William F. Bahl* | 69 | Chairman, Bahl & Gaynor Investment Counsel Inc. | ü | A, E, I, N (Chair) | 0 | |||||||||||
| Gregory T. Bier | 72 | Managing Partner (Retired), Deloitte LLP | ü | A, I | 0 | |||||||||||||||||
| Nancy C. Benacci | Nancy C. Benacci | 65 | Head of Equity Research (Retired), KeyBanc Capital Markets | ü | I | 0 | ||||||||||||||||
Linda W. Clement-Holmes | 56 | Chief Information Officer (Retired), The Procter & Gamble Company | ü | A, C, N | 0 | Linda W. Clement-Holmes | 58 | Chief Information Officer (Retired), The Procter & Gamble Company | ü | A, C, N | 1 | |||||||||||
| Dirk J. Debbink | 63 | Chairman and Chief Executive Officer, MSI General Corporation | ü | A, N | 0 | Dirk J. Debbink | 65 | Chairman and Chief Executive Officer, MSI General Corporation | ü | A, N | 0 | |||||||||||
| Steven J. Johnston | 59 | President and Chief Executive Officer, Cincinnati Financial Corporation | E (Chair), I | 0 | Steven J. Johnston | 61 | Chairman, President and Chief Executive Officer, Cincinnati Financial Corporation | E (Chair), I (Chair) | 0 | |||||||||||||
| Kenneth C. Lichtendahl | 70 | Director of Development and Sales, Heliosphere Designs LLC | ü | A, C | 0 | Kenneth C. Lichtendahl | 72 | Director of Development and Sales (Retired), Heliosphere Designs LLC | ü | C | 0 | |||||||||||
| W. Rodney McMullen | 58 | Chairman and Chief Executive Officer, The Kroger Co. | ü | C (Chair), E, I | 2 | |||||||||||||||||
| Jill P. Meyer | Jill P. Meyer | 49 | President and Chief Executive Officer, Cincinnati USA Regional Chamber | ü | A | 0 | ||||||||||||||||
| David P. Osborn | 58 | President, Osborn Williams & Donohoe LLC | ü | A, C, I | 0 | David P. Osborn | 60 | President, Osborn Williams & Donohoe LLC | ü | A, C (Chair), I | 0 | |||||||||||
| Gretchen W. Price | 64 | Executive Vice President, Chief Financial and Administrative Officer (Retired), Arbonne International LLC | ü | A (Chair), C, N | 0 | |||||||||||||||||
| Thomas R. Schiff | 71 | Chairman and Chief Executive Officer, John J. & Thomas R. Schiff & Co. Inc. | I | 0 | ||||||||||||||||||
| Gretchen W. Schar | Gretchen W. Schar | 66 | Executive Vice President, Chief Financial and Administrative Officer (Retired), Arbonne International LLC | ü | A (Chair), C, N | 1 | ||||||||||||||||
| Charles O. Schiff | Charles O. Schiff | 51 | Executive Vice President, Secretary and Treasurer, John J. & Thomas R. Schiff & Co. Inc. | I | 0 | |||||||||||||||||
| Douglas S. Skidmore | 56 | Chief Executive Officer, Skidmore Sales & Distributing Company Inc. | ü | A, N | 0 | Douglas S. Skidmore | 58 | Chief Executive Officer, Skidmore Sales & Distributing Company Inc. | ü | E, N | 0 | |||||||||||
| Kenneth W. Stecher | 72 | Chairman of the Board, Cincinnati Financial Corporation | E, I (Chair) | 0 | ||||||||||||||||||
| John F. Steele, Jr. | 65 | Chairman and Chief Executive Officer, Hilltop Basic Resources Inc. | ü | A, E | 0 | John F. Steele, Jr. | 67 | Chairman and Chief Executive Officer, Hilltop Basic Resources Inc. | ü | E | 0 | |||||||||||
| Larry R. Webb | 63 | President, Webb Insurance Agency Inc. | E, I | 0 | Larry R. Webb | 65 | President, Webb Insurance Agency Inc. | E, I | 0 | |||||||||||||
*Lead Independent Director
A Audit Committee
C Compensation Committee
E Executive Committee
I Investment Committee
N Nominating Committee
The named executive officers earned payouts of annual incentive compensation at the threshold level and performance basedperformance-based restricted stock units at the thresholdmaximum level for the performance period ending December 31, 2018,2020, which includedproduced a VCRvalue creation ratio (VCR) of -0.1 percent, exceeding three14.7%, outperforming four peer companies; and a three-year total shareholder return of 43.0 percent,26.5%, outperforming foureight peer companies. Set forth below is the 20182020 compensation for each named executive officer as determined under Securities and Exchange Commission (SEC) rules. See the notes accompanying the Summary Compensation Table (SCT) on Page 56 for more information.
| Name and Principal Position | Salary ($) | Bonus ($) | Stock Awards ($) | Option Awards ($) | Non- Equity Incentive Plan Compensa- tion ($) | Change in Pension Value and Non- Qualified Deferred Compensa- tion Earnings ($) | All Other Compensa- tion ($) | Total Compensa- tion ($) | ||||||||||||||||||
| Steven J. Johnston | 1,129,740 | — | 1,167,096 | 902,382 | 410,175 | — | 230,391 | 3,839,784 | ||||||||||||||||||
| Chairman, President & Chief Executive Officer | ||||||||||||||||||||||||||
| Michael J. Sewell | 940,608 | — | 663,834 | 443,968 | 204,907 | — | 158,331 | 2,411,648 | ||||||||||||||||||
| Chief Financial Officer | ||||||||||||||||||||||||||
| Martin F. Hollenbeck | 785,168 | — | 554,352 | 370,603 | 171,045 | — | 129,739 | 2,010,907 | ||||||||||||||||||
| Chief Investment Officer | ||||||||||||||||||||||||||
| Martin J. Mullen (Ret.) | 688,485 | — | 483,666 | 323,316 | 149,220 | 382,417 | 20,883 | 2,047,987 | ||||||||||||||||||
| Chief Claims Officer | ||||||||||||||||||||||||||
| John S. Kellington | 642,029 | — | 454,159 | 303,567 | 140,107 | — | 106,865 | 1,646,727 | ||||||||||||||||||
| Chief Information Officer | ||||||||||||||||||||||||||
| Stephen M. Spray | 735,773 | — | 530,243 | 354,462 | 163,597 | 530,698 | 31,173 | 2,345,946 | ||||||||||||||||||
| Chief Insurance Officer | ||||||||||||||||||||||||||
| Name and Principal Position | Salary ($) | Bonus ($) | Stock Awards ($) | Option Awards ($) | Non- Equity Incentive Plan Compensa- tion ($) | Change in Pension Value and Non- Qualified Deferred Compensa- tion Earnings ($) | All Other Compensa- tion ($) | Total Compensa- tion ($) | |||||||
| Steven J. Johnston | 1,025,385 | — | 999,111 | 849,752 | 339,900 | — | 230,462 | 3,444,610 | |||||||
| Chief Executive Officer & President | |||||||||||||||
| Jacob F. Scherer, Jr. | 949,152 | — | 638,786 | 464,800 | 185,918 | 621,358 | 26,991 | 2,887,005 | |||||||
| Chief Insurance Officer | |||||||||||||||
| Michael J. Sewell | 851,218 | — | 574,408 | 418,034 | 167,213 | — | 150,667 | 2,161,540 | |||||||
| Chief Financial Officer | |||||||||||||||
| Martin F. Hollenbeck | 710,560 | — | 479,777 | 348,963 | 139,582 | — | 120,935 | 1,799,817 | |||||||
| Chief Investment Officer | |||||||||||||||
| Martin J. Mullen | 616,919 | — | 418,678 | 304,423 | 121,767 | 104,226 | 22,883 | 1,588,896 | |||||||
| Chief Claims Officer | |||||||||||||||
No material changes were made to the structure of the executive compensation program in 2018.
2020.
Page 7
Security Ownership of Principal Shareholders and Management
Under Section 13(d) of the Securities Exchange Act of 1934 (Exchange Act), a beneficial owner of a security is any person who directly or indirectly has or shares voting power or investment authority over such security. A beneficial owner under this definition need not enjoy the economic benefit of such securities. The following are the only shareholders known to the company who are deemed to be beneficial owners of at least 5 percent5% of our common stock as of February 28, 2019.March 10, 2021.
| Title of Class | Name and Address of Beneficial Owner | Amount and Nature of Beneficial Ownership | Footnote Reference | Percent of Class | ||||||||||
| Common Stock | The Vanguard Group Inc. | 17,548,657 | (1) | 10.90 | ||||||||||
| 100 Vanguard Blvd. | ||||||||||||||
| Malvern, PA 19355 | ||||||||||||||
| Common Stock | BlackRock Inc. | 12,257,437 | (2) | 7.61 | ||||||||||
55 East 52nd Street | ||||||||||||||
| New York, NY 10055 | ||||||||||||||
| Common Stock | Select Equity Group L.P. | 9,110,578 | (3) | 5.66 | ||||||||||
380 Lafayette Street, 6th Floor | ||||||||||||||
| New York, NY 10003 | ||||||||||||||
| Common Stock | State Street Corporation | 8,842,778 | (4) | 5.49 | ||||||||||
| State Street Financial Center | ||||||||||||||
| One Lincoln Street | ||||||||||||||
| Boston, MA 02111 | ||||||||||||||
| Common Stock | Thomas R. Schiff | 8,573,732 | (5)(6)(7)(8) | 5.32 | ||||||||||
| Cincinnati Financial Corporation | ||||||||||||||
| 6200 South Gilmore Road | ||||||||||||||
| Fairfield, OH 45014 | ||||||||||||||
| Common Stock | Aristotle Capital Management LLC | 8,064,429 | (9) | 5.01 | ||||||||||
| 11100 Santa Monica Blvd., Suite 1700 | ||||||||||||||
| Los Angeles, CA 90025 | ||||||||||||||
Page 8
| Title of Class | Name and Address of Beneficial Owner | Amount and Nature of Beneficial Ownership | Footnote Reference | Percent of Class | ||
| Common Stock | The Vanguard Group Inc. | 18,383,549 | (1) | 11.27 | ||
| 100 Vanguard Blvd. | ||||||
| Malvern, PA 19355 | ||||||
| Common Stock | BlackRock Inc. | 13,530,397 | (2) | 8.29 | ||
| 55 East 52nd Street | ||||||
| New York, NY 10055 | ||||||
| Common Stock | State Street Corporation | 9,713,262 | (3) | 5.95 | ||
| State Street Financial Center | ||||||
| One Lincoln Street | ||||||
| Boston, MA 02111 | ||||||
| Common Stock | Thomas R. Schiff | 8,954,808 | (4)(5)(6)(7) | 5.49 | ||
| Cincinnati Financial Corporation | ||||||
| 6200 South Gilmore Road | ||||||
| Fairfield, OH 45014 | ||||||
The outstanding common shares beneficially owned by each other director and our named executive officers and total outstanding shares for all directors and executive officers as a group as of February 28, 2019,March 10, 2021, are shown below:
| Name of Beneficial Owner | Amount and Nature of Beneficial Ownership | Footnote Reference | Percent of Class | |||||
| Other Directors and Named Executive Officers | ||||||||
| William F. Bahl, CFA, CIC | 231,659 | (8) | 0.14 | |||||
| Gregory T. Bier, CPA (ret.) | 27,259 | 0.02 | ||||||
| Linda W. Clement-Holmes | 11,346 | 0.01 | ||||||
| Dirk J. Debbink | 30,477 | 0.02 | ||||||
| Martin F. Hollenbeck, CFA, CPCU | 111,401 | (9)(10) | 0.07 | |||||
| Steven J. Johnston, FCAS, MAAA, CFA, CERA | 384,552 | (9)(10) | 0.24 | |||||
| Kenneth C. Lichtendahl | 37,069 | 0.02 | ||||||
| W. Rodney McMullen | 52,594 | 0.03 | ||||||
| Martin J. Mullen | 121,663 | (7)(9) | 0.07 | |||||
| David P. Osborn, CFA | 40,649 | 0.02 | ||||||
| Gretchen W. Price | 28,319 | 0.02 | ||||||
| Jacob F. Scherer, Jr. | 243,282 | (7)(9) | 0.15 | |||||
| Michael J. Sewell, CPA | 151,574 | (7)(9)(10) | 0.09 | |||||
| Douglas S. Skidmore | 38,198 | (11) | 0.02 | |||||
| Kenneth W. Stecher | 198,156 | (7)(9) | 0.12 | |||||
| John F. Steele, Jr. | 25,467 | 0.02 | ||||||
| Larry R. Webb, CPCU | 501,774 | (12) | 0.31 | |||||
| All directors and nondirector executive officers as a group (27 individuals) | 11,680,039 | (4)(5)(6)(7)(8) (9)(10)(11)(12) | 7.16 | |||||
| Name of Beneficial Owner | Amount and Nature of Beneficial Ownership | Footnote Reference | Percent of Class | |||||||||||
| Other Directors and Named Executive Officers | ||||||||||||||
| Thomas J. Aaron, CPA | 5,839 | — | ||||||||||||
| William F. Bahl, CFA, CIC | 233,776 | (10) | 0.15 | |||||||||||
| Nancy C. Benacci | 1,702 | — | ||||||||||||
| Linda W. Clement-Holmes | 13,463 | 0.01 | ||||||||||||
| Dirk J. Debbink | 39,602 | 0.02 | ||||||||||||
| Martin F. Hollenbeck, CFA, CPCU | 184,634 | (11)(12) | 0.11 | |||||||||||
| Steven J. Johnston, FCAS, MAAA, CFA, CERA | 592,777 | (11)(12) | 0.37 | |||||||||||
| John S. Kellington | 152,784 | 0.09 | ||||||||||||
| Kenneth C. Lichtendahl | 39,186 | 0.02 | ||||||||||||
| Jill P. Meyer, Esq. | 1,628 | — | ||||||||||||
| David P. Osborn, CFA | 44,881 | 0.03 | ||||||||||||
| Gretchen W. Schar | 30,436 | 0.02 | ||||||||||||
| Charles O. Schiff | 1,787,619 | (8)(13) | 1.11 | |||||||||||
| Michael J. Sewell, CPA | 237,169 | (11)(12) | 0.15 | |||||||||||
| Douglas S. Skidmore | 46,560 | (14) | 0.03 | |||||||||||
| Stephen M. Spray | 114,271 | (8)(11) | 0.07 | |||||||||||
| John F. Steele, Jr. | 27,584 | (8) | 0.02 | |||||||||||
| Larry R. Webb, CPCU | 503,891 | (15) | 0.31 | |||||||||||
| All directors and nondirector executive officers as a group (27 individuals) | 11,996,950 | (4)(5)(6)(7)(8) (10)(11)(12) (13)(14)(15) | 8.22 | |||||||||||
Except as otherwise indicated in the notes below, each person has sole voting and investment power with respect to the common shares noted.
(1) Reflects ownership as of December 31, 2020, according to Form 13G/A filed by The Vanguard Group Inc. on February 8, 2021.
(2) Reflects ownership as of December 31, 2020, according to Form 13G/A filed by BlackRock Inc. on January 28, 2021.
(3) Reflects ownership as of December 31, 2020, according to Form 13G/A filed by Select Equity Group, L.P. on February 12, 2021.
(4) Reflects ownership as of December 31, 2020, according to Form 13G filed by State Street Corporation on February 8, 2021.
(5) Includes 6,436,746 shares owned of record by the Mary R. Schiff and John J. Schiff Foundation. The trustees are Mr. T. Schiff and his two siblings, John J. Schiff, Jr. and Suzanne S. Reid, who share voting and investment power equally.
(6) Includes 107,186 shares owned of record by the John J. & Thomas R. Schiff & Co. Inc. pension plan, the trustees of which are Messrs. T. Schiff and J. Schiff, Jr., who share voting and investment power; and 124,249 shares owned by John J. & Thomas R. Schiff & Co. Inc. for which Messrs. T. Schiff and J. Schiff, Jr. share voting and investment power.
(7) Includes 165,591 shares held in Thomas R. Schiff Foundation and 222,530 shares held in TRS Investments LLC., of which Mr. T. Schiff has voting and investment power.
(8) Includes shares pledged as collateral as of December 31, 2020, in the amounts of; 638,200 for Mr. T. Schiff; 63,165 for Mr. C. Schiff; 36,239 for Mr. Spray; 4,500 for Mr. J. Steele, Jr. and 59,579 for the nondirector executive officers as a group.
(9) Reflects ownership as of December 31, 2020, according to Form 13G/A filed by Aristotle Capital Management, LLC on February 2, 2021.
(10) Includes 8,821 shares held in the Bahl Family Foundation, of which Mr. Bahl is president.
(11) Includes shares available within 60 days from exercise of stock options in the amount of 293,838 shares for Mr. Johnston; 141,324 shares for Mr. Sewell; 104,558 for Mr. Hollenbeck; 89,426 for Mr. Kellington; 72,999 for Mr. Spray and 369,992 shares for the nondirector executive officers as a group.
(12) Includes shares held in the company’s nonqualified savings plan for highly compensated associates in the amounts of 141,109 shares for Mr. Johnston; 5,287 shares for Mr. Hollenbeck; 12,732 shares for Mr. Sewell; and 13,258 shares for the nondirector executive officers as a group. Individuals participating in this plan do not have the right to vote these shares.
(13) Includes 1,011,863 shares held in three family trusts, all of which Mr. C. Schiff is a trustee, and 223,055 shares held in the Skylar Foundation, of which Mr. C. Schiff is a trustee.
Page 9
(14) Includes 7,035 shares owned of record by Skidmore Sales Profit Sharing Plan, of which Mr. Skidmore is an administrator and shares investment authority.
(15) Includes 186,257 shares owned of record by a limited partnership of which Mr. Webb is a general partner and 43,478 shares owned of record by a marital trust for the benefit of his wife and children.
Delinquent Section 16(A) Beneficial Ownership Reporting Compliance16(a) Reports
Directors, executive officers and 10 percent10% shareholders are required to report their beneficial ownership of our stock according to Section 16 of the Exchange Act. Those individuals are required by SEC regulations to furnish the company with copies of all Section 16(a) forms they file.
SEC regulations require us to identify in this proxy statement anyone who filed a required report late during the most recent calendar year. Based on our review of forms we received or written representations from reporting persons stating that they were not required to file these forms, we believe that all Section 16(a) filing requirements were satisfied on a timely basis during calendar year 2018.2020.
Information About the Board of Directors
The mission of the board is to encourage, facilitate and foster the long-term success of Cincinnati Financial Corporation. The board oversees management in the performance of the company’s obligations to our independent agents, policyholders, associates, communities and suppliers in a manner consistent with the company’s mission and with the board’s responsibility to shareholders to achieve the highestdeliver superior sustainable shareholder value over the long term.
Proposal 1 - Election of Directors
Directors are elected annually. The board of directors currently consists of 1415 directors, 1011 of whom are determined to be independent by the board, according to the definition of independence specified in the Nasdaq listing requirements. As previously announced, one of our current directors will not be standing for election and the size of the board will be reduced to 14 directors.
On November 16, 2018,13, 2020, the board, upon the recommendation of its nominating committee, unanimously nominated the 14 directors listed below for re-election to the board at the 20192021 Annual Meeting of Shareholders.
The directors elected at the Annual Meeting will hold office until the 20202022 Annual Meeting and until their successors are duly elected and qualified. Unless otherwise instructed, the persons named in the proxy card (the proxy holders) attached to this proxy statement, as filed with the SEC, intend to vote the proxies held by them for the election of the 14 nominees named below. The board of directors knows of no reason why these nominees should be unable or unwilling to serve, but if that should be the case, proxies received will be voted for the election of such other persons, if any, as the board of directors may designate.
Vote Required
Director nominees receiving more votes cast for their election than against will be elected directors of the company. Abstentions and broker nonvotes have no effect on the voting for this proposal.
The board of directors recommends a vote FOR Thomas J. Aaron, William F. Bahl, Gregory T. Bier,Nancy C. Benacci, Linda W. Clement-Holmes, Dirk J. Debbink, Steven J. Johnston, Kenneth C. Lichtendahl, W. Rodney McMullen,Jill P. Meyer, David P. Osborn, Gretchen W. Price, Thomas R.Schar, Charles O. Schiff, Douglas S. Skidmore, Kenneth W. Stecher, John F. Steele, Jr. and Larry R. Webb as directors to hold office until the 20202022 Annual Meeting of Shareholders and until their successors are elected and seated.
Nominees for Directors for Terms of Your CompanyOffice Continuing until 2021
Each of our directors brings to our board extensive management and leadership experience gained through their service as executives and, in several cases, chief executive officers of diverse businesses. In these executive roles, they have taken hands-on, day-to-day responsibility for strategy and operations, including management of capital, risk and business cycles. In addition, most current directors bring public company board experience – either significant experience on other boards or long service on our board – that broadens their knowledge of board policies and processes, rules and regulations, and issues and solutions. Further, each director has civic and community involvement that mirrors our company’s values emphasizing personal service, relationships and local decision making. The nominating committee’s process to recommend qualified director candidates is described on Page 2726 under Director Nomination Considerations and Process.
| Aaron | Bahl | Benacci | Clement-Holmes | Debbink | Johnston | Lichtendahl | Meyer | Osborn | Schar | C. Schiff | Skidmore | Steele | Webb | |||||||||||||||||||||||||||||||
| Business Management | X | X | X | X | X | X | X | X | X | X | X | X | X | X | ||||||||||||||||||||||||||||||
| Leadership | X | X | X | X | X | X | X | X | X | X | X | X | X | X | ||||||||||||||||||||||||||||||
| Financial Expertise | X | X | X | X | X | X | ||||||||||||||||||||||||||||||||||||||
| Insurance | X | X | X | X | X | |||||||||||||||||||||||||||||||||||||||
| Investment | X | X | X | X | ||||||||||||||||||||||||||||||||||||||||
| Legal | X | |||||||||||||||||||||||||||||||||||||||||||
| Accounting and Auditing | X | X | X | |||||||||||||||||||||||||||||||||||||||||
| Technology and Information Security | X | X | ||||||||||||||||||||||||||||||||||||||||||
| Innovation | X | X | X | |||||||||||||||||||||||||||||||||||||||||
| Civic and Community Involvement | X | X | X | X | X | X | X | X | X | X | X | X | X | X | ||||||||||||||||||||||||||||||
| Independence | X | X | X | X | X | X | X | X | X | X | X | |||||||||||||||||||||||||||||||||
| Diversity | X | X | X | X | ||||||||||||||||||||||||||||||||||||||||
The biographies of our current directors,director nominees, including their names, ages, the year first elected as a director, their present positions, principal occupations and public company directorships held in the past five or more years begin on Page 13. For each director, we also describe specific individual qualifications and skills that contribute to the overall effectiveness of our board and its committees.
Biographical Information About Our DirectorsDirector Nominees
(Data as of February 28, 2019)March 10, 2021)


CPA
Age: 59
Director since 2019
Committees: Audit
U.S. Property Casualty Insurance Subsidiary Director
Mr. Aaron was executive vice president and chief financial officer from 2017 to 2019 of Community Health Systems Inc., one of the largest publicly traded hospital companies in the nation and a leading operator of acute care hospitals. He retired in 2019, and currently advises that company. Prior to joining CHS in 2016, Mr. Aaron worked at Deloitte, providing consulting services in auditing and merger and acquisition strategy and serving as the firm’s Tennessee managing partner. He began his 32-year career with Deloitte working with property casualty and reinsurance clients before transitioning his audit focus to large, national healthcare organizations.
Mr. Aaron’s financial expertise and experience as an engaged executive and board member equips him to understand and guide management decisions and actions related to planning, risk management, investor relations and capital management.
Selected Directorships and Memberships
University of Kentucky, Masters of Accounting Advisory Board (2015-present)
American Institute of Certified Public Accountants and Healthcare Financial Management Association

William F. Bahl
CFA, CIC
Age: 6769
Director since 1995
Independent Lead Director
Committees: Nominating (chair), Audit,
Executive, Investment
U.S. Insurance Subsidiary Director
Mr. Bahl is chairman of the board of Cincinnati-based Bahl & Gaynor Investment Counsel Inc. Prior to co-founding Bahl & Gaynor in 1990, he was senior vice president and chief investment officer at Northern Trust Company in Chicago, having previously worked for Fifth Third Bank and Mellon Bank.
Mr. Bahl’s independent registered investment advisory firm performs financial analysis of publicly held securities, advising and managing portfolios for high net worth individuals and institutional clients. His expertise helps support the board’s oversight of our investment operations, which continue to be our main source of profits. His familiarity with public company governance structures and policies beyond our own contributes to full discussion and evaluation of our options.
Former Public Company Directorships
LCA-Vision Inc. (2005-2014)
Selected Directorships and Memberships
Nonprofit boards benefiting parks, schools, a hospital association and youth organizations

Page 13

Age: 7265
Director since 20062020
U.S. Property Casualty Insurance Subsidiary Director
shareholders.
Selected Directorships and Memberships
Board Member, John Carroll University (2006-2017; 2019-present)
Board Member, Boys Hope Girls Hope of Northeast Ohio (2004-present)
Nonprofit boards benefiting several high schools, colleges, social servicescancer patients and civic organizationsstudent scholarships


Linda W. Clement-Holmes
Age: 5658
Director since 2010
Committees: Audit, Compensation, Nominating
Ms. Clement-Holmes was chief information officer of publicly traded The Procter & Gamble Company from 2015 to 2017. She retired from Procter & Gamble on January 31,in 2018, following a 35-year career. As Procter & Gamble’s chief information officer, Ms. Clement-Holmes led the entire global information technology organization (2,500 IT professionals), set strategic direction and drove technology innovation. From 2010 to 2014, she was senior vice president of Global Business Services and also served as chief diversity officer from 2010 to 2012.2012.
Ms. Clement-Holmes built her expertise in leveraging emerging business technologies to support speed and innovation during her career at Procter & Gamble. Her aptitude and accomplishments in these areas help our board to effectively evaluate our business processes and technology initiatives, supporting alignment of those initiatives with our strategic goals.goals.
Other Public Company Directorships
Board Member, Fifth Third Bancorp (2020- present)
Selected Directorships and Memberships
Member, IT Senior Management Forum
(2000-present)
Board Member, CincyTech (2016-present)
Member, Chief Information Officer Strategy Exchange (2015-2017)
Board Member, Cintrifuse (2016-2017)
Nonprofit boards benefiting women, families and child care,childcare, educational and civic organizations, professional IT organizations and the American Heart Association
Page 14


Dirk J. Debbink
Age: 6365
Director since 2012
Committees: Audit, Nominating
Mr. Debbink is chairman since 2007 and chief executive officer since 2012 of MSI General Corporation, a privately owned design/build construction firm. He joined MSI General in 1983, holding various positions of increasing leadership responsibility and serving as the company’s president from 1991 to 2007.
Mr. Debbink has served as a leader of organizations ranging from small firms typical of the company’s commercial policyholders to extremely large organizations, including Reserve Deputy Commander of U.S. Pacific Fleet (170,000 sailors) and Commander, Navy Reserve Force (64,000 sailors). While on active duty with the U.S. Navy, he served as a senior member of the staff of the Chief of Naval Operations in the Pentagon. He has extensive experience in strategic planning and execution, sales, marketing, information technology for a worldwide dispersed workforce, human resources, including pension and profit-sharing plans, and government relationships at the federal level.
Selected Directorships and Memberships
Board Member, Fisher House Wisconsin
(2014-present)
Board Member, Froedtert Health System
(2014-present)
Board Member, U.S. Naval Institute
(2012-2019)


Steven J. Johnston
FCAS, MAAA, CFA, CERA
Age: 5961
Director since 2011
Chairman, President and Chief Executive Officer and President
Committees: Executive (chair), Investment (chair)
U.S. Insurance Subsidiary Director
Mr. Johnston has been chief executive officer of the company and its U.S. subsidiaries, and president of the company and its lead subsidiary, The Cincinnati Insurance Company, since 2011. From 2008 to 2011, he was chief financial officer, senior vice president and secretary for both the company and The Cincinnati Insurance Company, and treasurer of the company.
As chief executive officer of Cincinnati Financial Corporation, Mr. Johnston provides the board with information gained from hands-on management of our operations, identifying our near‑term and long-term challenges, opportunities and strategies. His management and actuarial expertise and his experience driving technology and efficiency improvements combine with his strong communication skills to aid in his role as liaison between the board and the company management team.
Selected Directorships and Memberships
Member, American Academy of Actuaries
(1987-present)
Fellow, Casualty Actuarial Society (1990-present)
Chartered Financial Analyst (1997-present)
Chartered Enterprise Risk Analyst
(2013-present)
Page 15


Kenneth C. Lichtendahl
Age: 7072
Director since 1988
Committees: Audit, Compensation
Mr. Lichtendahl is thewas a director of development and sales for Heliosphere Designs LLC, a private company marketing solar timepieces.until his retirement in 2020. From 2011 to 2012, he served as a senior adviser for Nestle Waters of North America, following Nestle’s acquisition of Sweet Leaf Tea, which had acquired Tradewinds Beverage Company in 2010. From 1996 to 2010, Mr. Lichtendahl was president and a director of Tradewinds, a privately owned, Cincinnati-based company formed following the sale of Hudepohl-Schoenling.
Mr. Lichtendahl’s years of service on our board and audit committee supports institutional continuity with company and industry knowledge accumulated through all phases of industry and economic cycles and through our expansion over that period. He brings valuable insights gained in developing customer relationships, ethical practices, high-quality staff and product differentiation that helped turn his company, Hudepohl-Schoenling Brewing Co., into the 10thlargest brewer in the United States before its sale in 1996.
Selected Directorships and Memberships
Nonprofit boards benefiting youth, civic and conservation organizations


Age: 5849
Director since 20012019
Committees: Compensation (chair), Executive, InvestmentAudit
U.S. Property Casualty Insurance Subsidiary Director
Selected Directorships and Memberships
Board Member, 3CDC (2016-present)
Board Member, REDI Cincinnati Center City Development Corporation (2014-present)
Board Member, CincinnatiCincyTech (2015-present)
Member, Federal Reserve Bank of Cleveland-Cincinnati Business Committee (2015-present)Advisory Council (2020-present)
Page 16


David P. Osborn
CFA
Age: 5860
Director since 2013
Committees: Compensation (chair), Audit, Investment
U.S. Insurance Subsidiary Director
Since 2012, Mr. Osborn has been president of Cincinnati-based Osborn Williams & Donohoe LLC. He joined its predecessor firm in 1993, becoming a partner in 2010.
Mr. Osborn draws on more than 30 years of experience as an investment professional to lead his independent investment advisory firm’s dividend growth strategy team. This dividend growth strategy mirrors our own investment strategy, supporting investment committee decisions. His experiences building relationships and setting long-term, strategic business plans enhance board discussions of our company's long-term outlook and strategic planning activities.
Selected Directorships and Memberships
Board Member, Cincinnati Children’s Hospital (2016-present)
Trustee, Greater Cincinnati Foundation
(2017-present)
Nonprofit boards benefiting arts, education, youth services and the care of adults with neurological disorders


Gretchen W. PriceSchar
Age: 6466
Director since 2002
Committees: Audit (chair), Compensation, Nominating
Ms. PriceSchar retired June 14,in 2018 from Arbonne International LLC, a beauty and nutritional product company headquartered in Irvine, California. As executive vice president and chief financial and administrative officer of the firm since 2011, she led the firm’s financial, accounting, strategy and business planning, operations, information technology, human resources and international functions. She was executive vice president and chief financial officer from 2008 to 2011 of Philosophy Inc., an international, prestige beauty brand based in Phoenix, Arizona.
Ms. Price’sSchar’s executive positions have developed her expertise in areas of focus for our board, including accounting, auditing and financial reporting, investor relations, capital management, human resources, information technology, strategic planning and business planning. Board discussions and decisions benefit from her knowledge of customer relationship management and distribution chains.
Other Public Company Directorships
Board Member, Carter's Inc. (2019-present)
Board Member, Beam Inc. (2012-2015)
Selected Directorships and Memberships
Co-Treasurer, Stone Canyon Community Foundation (2018-2020)
Page 17


Age: 7151
Director since 19752020
U.S. Property Casualty Insurance Subsidiary Director
Mr. Charles Schiff has been chairmanis executive vice president, secretary and chief executive officer since 1996 and a director and an agent withtreasurer of John J. & Thomas R. Schiff & Co. Inc., a privately owned, Cincinnati-based independent insurance agency. He wasWorking in the insurance industry since 2002, he excels in learning his clients’ businesses and recommending appropriate risk management strategies, including insurance products and services that help his clients achieve their goals. In addition to maintaining a profitable insurance book of business, he oversees the agency’s president from 1983 to 1996.financial management and governance activities.
As a director, Mr. Schiff brings extensive knowledge of the insurance marketplace, consumer buying habits and trends in competition. He also is chief executive officer and chairman of Lightborne Properties and Lightborne Communications, privately owned media companies based in the Cincinnati area.
Selected Directorships and Memberships
Nonprofit boards benefiting fine and performing arts, arts education, a hospital, children’s dental services and general philanthropy


Douglas S. Skidmore
Age: 5658
Director since 2004
Committees: Audit,Executive, Nominating
Mr. Skidmore has been chief executive officer since 2003 and director since 1994 of Skidmore Sales & Distributing Company Inc., a privately owned, Cincinnati-based, full-service independent distributor and broker of quality industrial food ingredients. He was president from 1994 to 2013 and marketing manager from 1990 to 1994.
Mr. Skidmore has been responsible in his executive roles for strategic direction, marketing, human resources and overall growth and performance of his second-generation family business, which shares many characteristics with our typical commercial policyholders. In addition to providing a policyholder view of our products and services, he has management experience that equips him to contribute to the board’s oversight of business processes and technology initiatives.
Selected Directorships and Memberships
Member, Institute of Food Technologists
(1990-present)
Board Member, Athletes in Action (2013-present)
Board Member, Cincinnati Opera (2018-present)
Trustee, Food Ingredient Distributors Association (2005-2015)

Page 18


John F. Steele, Jr.
Age: 6567
Director since 2005
Committees: Audit, Executive
U.S. Property Casualty Insurance Subsidiary Director
Mr. Steele is chairman since 2004, chief executive officer since 1994 and a director since 1985 of Hilltop Basic Resources Inc., a privately owned, Cincinnati-based aggregates and ready-mix concrete supplier to the construction industry.
Mr. Steele has provided his firm with corporate oversight and strategic direction of all aspects of business ownership, operations and customer relationships. He brings to our board a policyholder perspective, including intimate knowledge of family-run corporations and the construction industry, which is the source of approximately 40 percent40% of our commercial general liability insurance premiums.
Selected Directorships and Memberships
Board Member, National Stone, Sand & Gravel Association (2001-2010; 2013-present)
Board Member, Lykins Companies Inc.
(2012-present)
Board Member, Smook Bros. Inc. (2006-2010)


Larry R. Webb
CPCU
Age: 6365
Director since 1979
Committees: Executive, Investment
U.S. Insurance Subsidiary Director
Mr. Webb has been president since 1994 and director since 1980 of Webb Insurance Agency Inc., a privately owned, independent insurance agency based in Lima, Ohio. Prior to becoming president, he was treasurer of the agency from 1981 to 1994. He has been a licensed insurance agent since 1977.
Mr. Webb brings to our board his insights as a principal owner of an independent insurance agency, with duties in financial management and accounting oversight, information technology, human resources, sales and marketing, risk management and relationship development with insurance companies and clients. His long tenure on our board and as a large shareholder, as well as his agency’s representation of our products and services since 1951, brings the board deep institutional knowledge, promoting continuity of the agent-centered mission and values essential to our business model. His agency does not advise the company on our insurance needs or sell insurance products or services to the company.
Selected Directorships and Memberships
Board Member, SWD Corporation (2010-present)
Nonprofit boards benefiting cancer research, an airport authority, hospital and cultural organizations
Page 19
Committees of the Board and Meetings
There are five standing committees of the board: audit, compensation, executive, investment and nominating. Each committee operates pursuant to a written charter adopted by the board, copies of which are posted on cinfin.com/investors. Each year the board considers changes to the charters recommended by each committee, if any, and reapproves them.
As the pandemic and other events of 2020 unfolded, the board increased the number and frequency of its meetings, enhancing its ability to provide effective oversight as management addressed matters such as the prioritization of the health and safety of our associates, agents and policyholders; near-term and longer-term financial effects; increased attention to cyber security defenses and enhanced audit procedures deemed appropriate as nearly all of our headquarters associates transitioned to work from home; pandemic legal and regulatory developments; and diversity, equity and inclusion efforts.
The following table summarizes the current membership of the board and each of its committees, as well as the number of times the board and each committee met during 2018:2020:
| Board | Audit | Compensation | Executive | Investment | Nominating | |||||||||||||||
| Mr. Aaron | X | X | ||||||||||||||||||
| Mr. Bahl | X | X | X | X | Chair | |||||||||||||||
| Ms. Benacci | X | X | ||||||||||||||||||
| Ms. Clement-Holmes | X | X | X | X | ||||||||||||||||
| Mr. Debbink | X | X | X | |||||||||||||||||
| Mr. Johnston | Chair | Chair | Chair | |||||||||||||||||
| Mr. Lichtendahl | X | X | ||||||||||||||||||
| Ms. Meyer | X | X | ||||||||||||||||||
| Mr. Osborn | X | X | Chair | X | ||||||||||||||||
| Ms. Schar | X | Chair | X | X | ||||||||||||||||
| Mr. C. Schiff | X | X | ||||||||||||||||||
| Mr. T. Schiff | X | X | ||||||||||||||||||
| Mr. Skidmore | X | X | X | |||||||||||||||||
| Mr. Steele, Jr. | X | X | ||||||||||||||||||
| Mr. Webb | X | X | X | |||||||||||||||||
| Number of 2020 meetings | 14 | 4 | 4 | 3 | 6 | 6 | ||||||||||||||
| Board | Audit | Compensation | Executive | Investment | Nominating | |
| Mr. Bahl | X | X | X | X | Chair | |
| Mr. Bier | X | X | X | |||
| Ms. Clement-Holmes | X | X | X | X | ||
| Mr. Debbink | X | X | X | |||
| Mr. Johnston | X | Chair | X | |||
| Mr. Lichtendahl | X | X | X | |||
| Mr. McMullen | X | Chair | X | X | ||
| Mr. Osborn | X | X | X | X | ||
| Ms. Price | X | Chair | X | X | ||
| Mr. T. Schiff | X | X | ||||
| Mr. Skidmore | X | X | X | |||
| Mr. Stecher | Chair | X | Chair | |||
| Mr. Steele, Jr. | X | X | X | |||
| Mr. Webb | X | X | X | |||
| Number of 2018 meetings | 7 | 4 | 4 | 4 | 6 | 3 |
Board members are expected to attend the Annual Meeting of Shareholders, all meetings of the board and the meetings of committees of which they are a member. In 2018,2020, all directors attended the Annual Meeting of Shareholders and each attended at least 93 percent96% of the meetings indicated above for the board and committees of which they were members.
The annual meeting of directors is held immediately following the Annual Meeting of Shareholders at the same location.Shareholders. The board of directors will review committee assignments at its meeting on April 27, 2019.May 8, 2021.
Audit Committee - The audit committee oversees the process of accounting and financial reporting, audits and financial statements of the company. The report of the audit committee begins on Page 68.
All of the members of the audit committee are believed to meet the Nasdaq criteria for independence and audit committee membership and the independence criteria of Section 10A-3 of the Exchange Act. Further, Mr. Bahl,Aaron, Mr. Bier,Bahl, Mr. Osborn and Ms. PriceSchar qualify as financial experts according to the SEC definition and meet the standards established by Nasdaq for financial expertise.
Page 20
Compensation Committee - The compensation committee discharges the responsibility of the board of directors relating to compensation of the company’s directors, its executive officers and its internal audit officer. The committee also administers the company’s stock compensation and annual incentive compensation plans. The report of the compensation committee begins on Page 32.31.
All of the members of the compensation committee are believed to meet the Nasdaq criteria for independence and qualify as “nonemployee“non-employee directors” for purposes of Rule 16b-3 of the Exchange Act. They also are believed to meet the definition of “outside directors” for purposes of Section 162(m) of the Internal Revenue Code of 1986 (Section 162(m)) as respects performance-based compensation granted prior to November 2, 2017.
Executive Committee - The executive committee exercises the powers of the board of directors in the management of the business and affairs of the company between meetings of the board of directors. Independence requirements do not apply to the executive committee.
Investment Committee - The investment committee provides oversight of the policies and procedures of the investment department of the company and its subsidiaries and reviews the invested assets of the company. The objective of the committee is to oversee the management of the portfolio to ensure the long-term security of the company. Independence requirements do not apply to the investment committee.
Nominating Committee - The nominating committee identifies, recruits and recommends qualified candidates for election as directors and officers of the company and as directors of its subsidiaries. The committee also nominates directors for committee membership. Further, the committee oversees the corporate governance and compliance policies of the company. Information about the director nomination process begins on Page 27.26.
All of the members of the nominating committee are believed to meet the Nasdaq criteria for independence.
Page 21
Compensation of NonemployeeNon-Employee Directors
In 2018, nonemployee2020, non-employee directors were compensated for their board service as follows:
as:
| Annual Cash Retainer | $40,000 | ||||
| Annual Stock Retainer | $40,000 | ||||
| Chairman Annual Cash | $50,000 | ||||
| Lead Director Annual Cash Retainer | $25,000 | ||||
| Independent Committee Chair Cash Retainer | $10,000 | ||||
| Meeting Fees - Cash | $4,500 per board meeting $1,500 per committee meeting (except investment committee) $6,000 per investment committee meeting $7,500 maximum per day $60,000 minimum per calendar year | ||||
| Meeting Fees - Stock | Matches cash meeting fees up to maximum of $60,000 per year | ||||
*When the chairman is not an executive of the company.
The Committeecompensation committee grants the stock awards for each director’s prior year’s board service at its first scheduled meeting each calendar year. See Stock-Based Award Grant Practices, Page 48. Amounts shown in the Stock Awards column of the 20182020 Director Compensation table reflect grants awarded under the 20092018 Stock Plan at the Committee’scommittee’s meeting on January 31, 2019,28, 2021, for board service in 2018.2020.
The company also provides outside directors with life insurance, personal umbrella liability insurance and spouse travel and meals for certain business events. See Perquisites and Other Personal Benefits, Page 49, for details about these benefits. Amounts contained in the All Other Compensation column of the 20182020 Director Compensation table reflect the aggregate cost of these individual benefits.
The company does not provide outside directors with retirement benefits, benefits under health and welfare plans or compensation in any form not described above, nor does it have any agreement with any director to make charitable donations in the director’s name.
Page 22
| Name | Fees Earned or Paid in Cash ($) | Stock Awards ($) (2) | All Other Compensation ($) (3) | Total ($) | ||||||||||
| Thomas J. Aaron | 119,500 | 100,070 | 1,657 | 221,227 | ||||||||||
| William F. Bahl | 199,500 | 100,070 | 2,791 | 302,361 | ||||||||||
| Nancy C. Benacci | 60,005 | 60,042 | 515 | 120,562 | ||||||||||
| Gregory T. Bier* | 45,017 | 45,074 | 1,289 | 91,380 | ||||||||||
| Linda Clement-Holmes | 124,000 | 100,070 | 2,196 | 226,266 | ||||||||||
| Dirk J. Debbink | 118,000 | 100,070 | 2,032 | 220,102 | ||||||||||
| Kenneth C. Lichtendahl | 112,000 | 100,070 | 1,646 | 213,716 | ||||||||||
| W. Rodney McMullen* | 48,396 | 45,074 | 1,417 | 94,887 | ||||||||||
| Jill P. Meyer | 119,500 | 100,070 | 1,140 | 220,710 | ||||||||||
| David P. Osborn | 156,000 | 100,070 | 1,927 | 257,997 | ||||||||||
| Gretchen W. Schar | 132,500 | 100,070 | 1,239 | 233,809 | ||||||||||
| Charles O. Schiff | 59,399 | 59,443 | 652 | 119,494 | ||||||||||
| Thomas R. Schiff | 139,000 | 100,070 | 1,568 | 240,638 | ||||||||||
| Douglas S. Skidmore | 119,500 | 100,070 | 1,771 | 221,341 | ||||||||||
| Kenneth W. Stecher* | 61,913 | 45,074 | 1,146 | 108,133 | ||||||||||
| John F. Steele, Jr. | 124,000 | 100,070 | 2,064 | 226,134 | ||||||||||
| Larry R. Webb | 148,000 | 100,070 | 9,764 | 257,834 | ||||||||||
| Name | Fees Earned or Paid in Cash ($) | Stock Awards ($) (2) | All Other Compensation ($) (3) | Total ($) | |||||
| William F. Bahl | 168,000 | 100,052 | 10,803 | 278,855 | |||||
| Gregory T. Bier | 118,000 | 100,052 | 10,020 | 228,072 | |||||
| Linda Clement-Holmes | 88,000 | 88,049 | 2,196 | 178,245 | |||||
| Dirk J. Debbink | 82,000 | 82,008 | 10,123 | 174,131 | |||||
| Kenneth C. Lichtendahl | 79,000 | 79,027 | 9,839 | 167,866 | |||||
| W. Rodney McMullen | 129,500 | 100,052 | 1,692 | 231,244 | |||||
| David P. Osborn | 113,500 | 100,052 | 8,799 | 222,351 | |||||
| Gretchen W. Price | 98,000 | 88,049 | 1,239 | 187,288 | |||||
| Thomas R. Schiff | 107,500 | 100,052 | 1,568 | 209,120 | |||||
| Douglas S. Skidmore | 82,000 | 82,008 | 12,094 | 176,102 | |||||
| Kenneth W. Stecher | 169,500 | 100,052 | 1,421 | 270,973 | |||||
| John F. Steele, Jr. | 97,000 | 97,072 | 2,064 | 196,136 | |||||
| Larry R. Webb | 116,500 | 100,052 | 9,764 | 226,316 | |||||
(1) Mr. Johnston is chairman of the board, chief executive officer and president of the company. Compensation for Mr. Johnston is shown |
(2) Stock awards for non-employee directors under the Cincinnati Financial Corporation Non-Employee Directors Stock Plan of $275 paid for life insurance for2018 were valued at fair market value determined by the benefitaverage of the directorhigh and perquisiteslow sales price on Nasdaq on January 28, 2021, the date of grant, times the number of shares awarded. The per share fair market value on January 28, 2021, was $85.53. The number of shares granted to directors reported in the amount of $11,819, which includes $10,323 for the incremental additional cost of spouse travelthis column were: 1,170 to Mr. Aaron; 1,170 to Mr. Bahl; 702 to Ms. Benacci; 527 to Mr. Bier; 1,170 to Ms. Clement-Holmes; 1,170 to Mr. Debbink; 1,170 to Mr. Lichtendahl; 527 to Mr. McMullen; 1,170 to Ms. Meyer; 1,170 to Mr. Osborn; 1,170 Ms. Schar; 695 to Mr. C. Schiff; 1,170 to Mr. T. Schiff; 1,170 to Mr. Skidmore; 527 to Mr. Stecher; 1,170 to Mr. Steele; and meals for business events1,170 to which spouses are invited and premiums in the amount of $1,496 for a personal umbrella liability policy.Mr. Webb.
Governance of Your Company
Governance Policies and Practices
Our primary governance policies and practices are set forth in our Corporate Governance Guidelines, Code of Ethics for Senior Financial Officers and Code of Conduct applicable to all associates of the company. The nominating committee reviews these documents annually and, when appropriate, recommends changes for the board’s consideration and approval. These guidelines and codes are available on cinfin.com/investors.
Certain of the board’s governance policies and practices are summarized below:
Code of Conduct - Our Code of Conduct applies to the company and its U.S. subsidiaries and all of their associates, including officers and directors. It establishes ethical standards for a variety of topics, including complying with laws and regulations, observing blackout periods for trading in the company’s securities, accepting and giving gifts, handling conflicts of interest, handling the company’s confidential information and personal data of consumers, and reporting illegal or unethical behavior.
Governance Hotline - Our audit committee oversees a governance hotline for the reporting of concerns about the company’s auditing, accounting and financial reporting activities. Callers can remain anonymous or identify themselves. The hotline is maintained by a third-party vendor. Reports of all calls are reportedprovided to the audit committee.
Board Leadership and Executive Sessions - The chairman of the board presides at all meetings of the board of directors. The chairman is appointed on an annual basis by at least a majority vote of the other directors. Currently,In 2020, the offices of chairman of the board and chief executive officer are separated.were combined, returning to the company's traditional board leadership structure. The company has no fixed policy with respect to the separation of the offices of the chairman of the board and chief executive officer. The board believes that the separation of the offices of the chairman of the board and chief executive officer is part of the succession planning process and that it is in the best interests of the company to make this determination from time to time. Indeed, throughout the company's history, the board has chosen at times to combine or separate these roles based on the facts and circumstances then existing.
When the chairman of the board is not an independent director, the board appoints the chairman of the nominating committee as the board’s lead independent director. The company’s Corporate Governance Guidelines describe the authority and duties of the lead director. These include chairing the executive sessions of board meetings without management present, facilitating the communication between the independent directors and management on matters of interest and participating in the preparation of meeting agendas and materials sent to directors. The independent directors meet in executive session, without management present, at every regularly scheduled meeting of the board of directors.
Stock Ownership Guidelines - Our directors and officers are subject to stock ownership guidelines that set targets for levels of ownership at a multiple of the officer’s salary or director’s meeting fees. As of December 31, 2018,2020, all of our directors and executive officers were in compliance with the guidelines. Director and Officer Ownership Guidelines are available on cinfin.com/investors.
Board's Role in Risk ManagementOversight - The board believes that oversight of our risk management efforts is the responsibility of the entire board. It views enterprise risk management as an integral part of our strategic planning process. The subject of risk management is a recurring agenda item for whichEach quarter the board receives a comprehensive report at each regularly scheduled board meeting from the chief risk officer including in-person reports twice each year.on the status of risk metrics relative to identified and board-approved tolerances and limits, risk assessments and risk plans. The chief risk officer has direct access to all members of the board of directors.directors and presents at board meetings twice each year.
Page 24
Additionally, the charters of certain of the board’s committees assignboard delegates oversight responsibility for particular areas of risk.risk to its committees. For example, our audit committee oversees management of risks related to accounting, auditing and financial reporting, maintaining effective internal controls for financial reporting and cybersecurity. Our nominating committee oversees risk associated with our corporate governance and legal, regulatory and other nonfinancial compliance activities. Our compensation committee oversees the riskrisks related to our executive compensation plans and arrangements. Our investment committee oversees the risks related to managing our investment portfolio. All of these risks are discussed with the entire board in the ordinary course of the chairperson’s report of committee activities at regular board meetings.
Board Evaluations - The board annually conducts a self-evaluation. Led by the lead independent director, feedback from individual directors is reviewed and discussed first by the nominating committee and then with the entire board. These discussions include specific governance topics such as director tenure, board refreshment and composition as well as the diversity of experience, skills, competencies and other qualities of current directors and future director candidates. The board intends for this annual process to help inform its decisions about how to best structure and govern itself in the short- and long-term, enabling it to provide effective oversight of the company for the benefit of shareholders.
Director Independence - Each year, based on all relevant facts and circumstances, the board determines which directors satisfy the criteria for independence. To be found independent, a director must not have a material relationship with the company, either directly or indirectly as a partner (other than a limited partner), controlling shareholder or executive officer of another organization that has a relationship with the company that could affect the director’s ability to exercise independent judgment.
Directors deemed independent are believed to satisfy the definitions of independence required by the rules and regulations of the SEC and the listing standards of Nasdaq. The board has determined that these directors and nominees meet the applicable criteria for independence as of February 1, 2019:January 29, 2021: Thomas J. Aaron, William F. Bahl, Gregory T. Bier,Nancy C. Benacci, Linda W. Clement-Holmes, Dirk J. Debbink, Kenneth C. Lichtendahl, W. Rodney McMullen,Jill P. Meyer, David P. Osborn, Gretchen W. Price,Schar, Douglas S. Skidmore and John F. Steele, Jr. A majority, 1011 of our current 1415 directors, are believed to meet the applicable criteria for independence under Nasdaq listing standards.
Board Structure and Tenure - The board balancesseeks to balance its independence, size and tenure. Over time and without unnecessary disruption, its goal isGenerally, the board seeks to achieve a board with at least 75 percentcomprised of its directors qualifying as independent.75% independent directors. The insurance business is complex, requiring new directors to develop a deep understanding of both our insurance operations and investment activities. Once this knowledge is acquired, the board expects that these directors will continue their board service for a significant period. As a consequence, the board expects the average tenure of its independent directors to be higherelevated. Following the 2021 Annual Shareholder Meeting, the board expects its then 14-member board to include 11 independent directors (78.6%), of which five will have tenure 10 years or less and six will have tenure of greater than average.10 years.
Page 25
Director Nomination Considerations and Process - The nominating committee considers many factors when determining the eligibility of candidates for nomination as director. The committee does not have a diversity policy; however, the committee’s goal is to nominate candidates from a broad range of experiences and backgrounds who can contribute to the board’s overall effectiveness in meeting its mission. The committee is charged with identifying nominees with certain characteristics:
•Demonstrated character and integrity
•An ability to work with others
•Sufficient time to devote to the affairs of the company
•Specific skills and experiences that enhance the board's diversity and acumen
•Willingness to enter into a long-term association with the company, in keeping with the company’s overall business strategy
The nominating committee also considers the needs of the board in accounting and finance, business judgment, management, industry knowledge, leadership and such other areas as the board deems appropriate. The committee further considers factors included in the Corporate Governance Guidelines that might preclude nomination or renomination, including service on other public company boards. When a director is considering service on another public company's board, that director notifies the chairman of the board and the chairman of the nominating committee. Each year, when considering a director for renomination for election to the board, the nominating committee considers a director's service on other public company boards, weighing the potential benefit to our company against any potential negative impact of such service.
In particular, the nominating committee seeks to support our unique, agent-centered business model. The committee believes that the board should include a variety of individuals and should include independent insurance agents who bring a special knowledge of policyholders and agents in the communities where we do business.
Potential board nomineesdirector candidates generally are identified by referral. The nominating committee follows a five-part process to evaluate nominees for director. The committee first performs an initial screening that includes reviewing background information on the candidates, evaluating their qualifications against the criteria set forth in the company’s Corporate Governance Guidelines and the skills and competencies that may be identified by the committee or the board as desirable in future director candidates. As it believes is appropriate, the committee may discuss the potential candidates with the individual or individuals making the referrals. Second, for candidates who qualify for additional consideration, the committee interviews the potential nominees as to their background, business acumen, interests and potential commitment to the company and its operating philosophy. Third, the committee may seek references from sources identified by the candidates as well as sources known to the committee members. Fourth, the committee may ask other members of the board for their input. Finally, the committee develops a list of nomineespotential director candidates who exhibit the characteristics desired of directors that satisfy the needs of the board. The committee continuously curates the list of potential director candidates and is committed to ensuring that it includes diverse candidates.
The nominating committee will consider candidates recommended by shareholders. Shareholders wishing to propose a candidate for consideration may provide information about such a candidate in writing to the secretary of the company, giving the candidate’s name, biographical data and qualifications, and emphasizing the characteristics set forth in our Corporate Governance Guidelines available on cinfin.com/investors. Preferably, any such referral would contain sufficient information to enable the committee to preliminarily screen the referred candidate for the needs of the board, if any, in accounting and finance, business judgment, management, industry knowledge, leadership and the board’s independence requirements.
Page 26
Since the 20182020 Annual Meeting of Shareholders, no fees were paid to any third party to identify, evaluate or assist in identifying and evaluating potential nominees.
Communicating with the Board - Shareholders may direct a communication to board members by sending it to the attention of the corporate secretary of the company, Cincinnati Financial Corporation, P.O. Box 145496, Cincinnati, Ohio, 45250-5496. The company and board of directors have not established a formal process for determining whether all shareholder communication received by the corporate secretary will be forwarded to directors. The board welcomes shareholder communication and has instructed the corporate secretary to use reasonable criteria to determine whether correspondence should be forwarded. The board believes that correspondence has been and will continue to be forwarded appropriately. However, exceptions may occur, and the board does not intend to provide management with instructions that limit its ability to make reasonable business decisions. Examples of exceptions would be routine items such as requests for publicly available information that can be provided by company associates; vendor solicitations that appear to be mass-directed to board members of a number of companies; or correspondence that raises issues related to specific company transactions (insurance policies or claims) where there may be privacy concerns or other issues.
In some circumstances, the board anticipates that management would provide the board or board members with summary information regarding correspondence.
Page 27
Certain Relationships and Transactions
The audit committee follows a written policy for review and approval of transactions involving the company and related persons, defined as directors and executive officers or their immediate family members, or shareholders owning 5 percent5% or more of our outstanding common shares. The policy covers any related-party transaction that meets the minimum threshold for disclosure in the proxy statement under the relevant SEC rules, generally transactions involving amounts exceeding $120,000 in which a related person has a direct or indirect material interest.
As it examines individual transactions for approval, the committee considers:
•Whether the transaction creates a conflict of interest or would violate the company’s Code of Conduct
•Whether the transaction would impair the independence of a director
•Whether the transaction would be fair
•Any other factor the committee deems appropriate
Consideration of transactions with related parties is a regular item on the audit committee’s agenda. Most of the transactions fall into the categories of standard agency contracts with directors who are principals of independent insurance agencies that sell our insurance products or with directors and executive officers who purchase our insurance products on the same terms as such products are offered to the public. Because the committee does not believe these classes of transactions create conflicts of interest or otherwise violate our Code of Conduct, the committee deems such transactions preapproved.
The following transactions in 20182020 with related persons were determined to pose no actual conflict of interest and were approved by the committee pursuant to its policy:
Thomas R. Schiff is a directorand Charles O. Schiff are directors of Cincinnati Financial Corporation and the chief executive officer and executive vice president, secretary and treasurer, respectively, of John J. & Thomas R. Schiff & Co. Inc., a privately owned insurance agency that represents a number of insurance companies, including our insurance subsidiaries. Our subsidiaries paid John J. & Thomas R. Schiff & Co. Inc. fees and commissions of $6,139,958.$6,159,082. The company purchased various insurance policies through John J. & Thomas R. Schiff & Co. Inc. for premiums totaling $997,326.$1,110,538. John J. & Thomas R. Schiff & Co. Inc. paid rent to the company in the amount of $122,445 for office space located in the headquarters building and purchased property casualty insurance from our insurance subsidiaries for premiums totaling $136,395.$146,014.
Dirk J. Debbink is a director of Cincinnati Financial Corporation, and principal owner, director and chief executive officer of MSI General Corporation and is a control person for several development limited liability companies, which on a consolidatedan aggregated basis purchased property casualty and life insurance from our insurance subsidiaries for premiums totaling $169,584.$140,568.
Douglas S. Skidmore is a director of Cincinnati Financial Corporation and principal owner, director and chief executive officer of Skidmore Sales & Distributing Company Inc., which purchased property casualty insurance from our insurance subsidiaries for premiums totaling $712,974.$958,026.
John F. Steele, Jr. is a director of Cincinnati Financial Corporation and chairman and chief executive officer of Hilltop Basic Resources Inc., which purchased property casualty insurance from our insurance subsidiaries for premiums totaling $740,030.$907,948.
Page 28
Larry R. Webb is a director of Cincinnati Financial Corporation and president, director and a principal owner of Webb Insurance Agency Inc., a privately owned insurance agency that represents a number of insurance companies, including our insurance subsidiaries. The company’s insurance subsidiaries paid Webb Insurance Agency Inc. commissions of $1,272,203$1,196,575 as compensation for selling the company’s insurance products to the agency’s clients. This agency does not advise the company on our insurance needs or sell insurance products or services to the company.
Page 29
Compensation of Named Executive Officers and Directors
Proposal 2 - Say-on-Pay: Advisory Vote on Compensation of Named Executive Officers
We conduct a say-on-pay vote each year at the annual shareholder meeting. This say-on-pay vote is required by Section 14A of the Securities Exchange Act of 1934 (Exchange Act) and the related rules of the SEC. Although the say-on-pay vote is nonbinding, the compensation committee (Committee) considers the voting results as part of its annual evaluation of our executive compensation program. The annual frequency was selected by more than 90 percent90% of our shareholders who voted on the proposal at our 20182017 Annual Meeting of Shareholders.
•A meaningful portion of elevated levelseach officer's compensation should be tied to awards that require achievement of insured losses from hurricanes, wildfiresthe primary financial objectives by which we measure the company's performance;
•Compensation should include components consisting of both short-term and other catastrophic weather events. It also was a year that ended with a sharp decline in the equity markets. Your company delivered strong operating resultslong-term incentive-based pay to drive performance; and somewhat mixed financial performance that benefited shareholders with one-year and three-year total shareholder returns of 6.2 percent and 43.0 percent, respectively; a 4.4 percent decrease in book value;
•Compensation should include an opportunity for, and a 6.0 percent increase in regular cash dividends declared. This performance generated payoutsrequirement of annual incentive compensationequity ownership to align the interests of executives and performance-based restricted stock units at threshold levels for our named executive officers.shareholders.
Please read the Compensation Discussion and Analysis section for more detailed information about our executive compensation program and decisions to inform your vote on the following say-on-pay proposal:
“RESOLVED, that the company’s shareholders approve, on an advisory basis, the compensation of the named executive officers, as disclosed in the company’s proxy statement for the Cincinnati Financial Corporation 2019 Annual Shareholder Meeting pursuant to the compensation disclosure rulesItem 402 of the SEC,Regulation S-K, including the Compensation Discussion and Analysis, the 2018 Summary Compensation Tablecompensation tables and the other related tables and narrative disclosure.discussion.”
Vote Required
The affirmative vote of a majority of the shares represented in person or by proxy at the Annual Meeting that are entitled to vote on this proposal is required for approval. Votes to abstain have the same effect as votes against the proposal. Broker nonvotes have no effect on the voting for this proposal.
The board of directors recommends a vote FOR the resolution approving the compensation of our named executive officers as disclosed in this proxy statement.
Page 30
Report of the Compensation Committee
The compensation committeeCommittee reviewed and discussed the Compensation Discussion and Analysis with management. Based on the review and discussions, the Committee recommended to the board of directors that the Compensation Discussion and Analysis be included in the company’s 20192021 proxy statement.
Submitted by the compensation committee:Committee:
Linda W. Rodney McMullen (chair),Clement-Holmes, Kenneth C. Lichtendahl,
David P. Osborn (Chair) and Gretchen W. Schar
Compensation Committee Interlocks and Insider Participation
Linda W. Clement-Holmes, Kenneth C. Lichtendahl, David P. Osborn and Gretchen W. Price
Page 31
Compensation Discussion and Analysis
This Compensation Discussion and Analysis provides you with a detailed description of our executive compensation philosophy and programs, the compensation decisions the compensation committee (Committee)Committee has made under those programs and the factors considered in making those decisions. This Compensation Discussion and Analysis focuses on the compensation of our named executive officers for 2018,2020, who were:
| Name | Title | ||||
| Steven J. Johnston | Chairman, President and Chief Executive Officer | ||||
| Michael J. Sewell | Chief Financial Officer and Senior Vice President | ||||
| Martin F. Hollenbeck | Chief Investment Officer and Senior Vice President | ||||
| Martin J. | Chief Claims Officer and Senior Vice President (Retired) | ||||
| John S. Kellington | Chief Information Officer and Senior Vice President | ||||
| Stephen M. Spray | Chief Insurance Officer and Senior Vice President | ||||
•Mr. Mullen retired from the company on December 18, 2020
Executive Summary
Overview
Cincinnati Financial Corporation is one of the 25 largest property casualty insurers in the nation, based on net written premium volume from our U.S. insurance subsidiary. The U.S. property casualty insurance industry is a highly competitive marketplace with more than 2,000 stock and mutual companies operating independently or in groups. We compete with these companies, which offer standard market property casualty and/or excess and surplus lines and life insurance products as we do, seeking to increase our share of these multibillion-dollar markets. Critical to our long-term success are highly experienced, dedicated and capable executives who can manage our business day to day and who possess the vision to plan for and adjust to changes in the market. The objective of our executive compensation program is to attract, motivate, reward, develop and retain the executive talent required for our long-term success. We also must nurture the capabilities of our emerging leaders to ensure that we have an appropriate depth of executive talent. We believe that as an associate’s level of responsibility increases, so should the proportion of performance-based compensation. As a result, our executive compensation program aims to tie a meaningful level of each officer’s compensation to awards that require achievement of the primary financial objectives by which we measure the company’s performance, creating a firm link between pay and performance.
In 2018, our industry experienced a second consecutive year2020, your company continued its focus on helping the independent agents who represent us to grow profitably, even as it successfully met the challenges presented by the economic and operational effects of elevated levelsthe pandemic, the high number of insured losses from hurricanes, wildfiresweather catastrophe events, volatile equity markets and other catastrophic weather events. It also was a year that ended with a sharp decline in the equity markets.persistently low interest rates. Your company delivered strong financial and operating results and somewhat mixed financial performance that benefited shareholders with one-year anda three-year total shareholder returnsreturn of 6.2 percent and 43.0 percent, respectively;26.5%; a 4.4 percent decrease10.7% increase in book value;value to a record high of $67.04 per share at year end; and a 6.0 percent7.1% increase in regular cash dividends declared. This performance generated payouts of annual incentive compensation and performance-based restricted stock units at threshold and maximum levels, respectively, for our named executive officers. Highlights of our company's performance in 20182020 included:
•A 45 percent6% increase in consolidated property casualty net written premiums to more than $5.8 billion in 2020. The increase in premiums includes the contribution from Cincinnati Global Underwriting Ltd.SM, acquired in February 2019, and reflects our growth initiatives, and higher average price increases for most lines of business.
•A property casualty pre-tax underwriting profit to $186of $119 million and a combined ratio of 96.4 percent98.1% for 2018,2020, marking our seventhninth consecutive year of underwriting profit. In 2018,2020, our efforts to further segment our renewal and new business opportunities with better pricing precision and risk-selection decisions continued to benefit core underwriting performance.performance, before considering losses from weather catastrophe events.
Page 32
•A record-level of consolidated property casualty new business written premiums at $652$799 million, up 4 percent, driven by new agency appointment contributions.3%.
•A 4 percent$19 million or 7% increase in consolidated property casualty net writtenearned premiums to more than $5 billion in 2018. The increase in premiums reflectsproduced by our growth initiatives, modest average price increases for most lines of business and a higher level of insured exposures.
•$17.51622.442 billion in consolidated cash and invested assets, down 1 percentup 9% over the prior year.
•A 2 percent4% increase in pretax investment income to a record $619$670 million, net of expenses, reflecting a 6 percent9% increase in equity portfolio dividends and flat2% growth in interest income.
•A value creation ratio (VCR) of negative 0.1 percent14.7% for 2018,2020, exceeding that measure for three of the nine companies in our peer group. Our average annual VCR for the five-year period ending December 31, 2018, is 10.7 percent, within our announced goal of producing an annual average VCR of 10 percent10% to 13 percent13% in any five-year period.period and exceeding that measure for four of the nine companies in our peer group.
We consider VCR to be our primary performance metric for two reasons. First, we believe this measure captures the contribution of our insurance operations, the success of our investment strategy and the importance we place on paying cash dividends to shareholders. Second, as demonstrated in the chart below, the VCR has historically been directly correlated to the returns experienced by our shareholders for their investment in our common stock over the long term.
Start with $1 Invested in 1987...
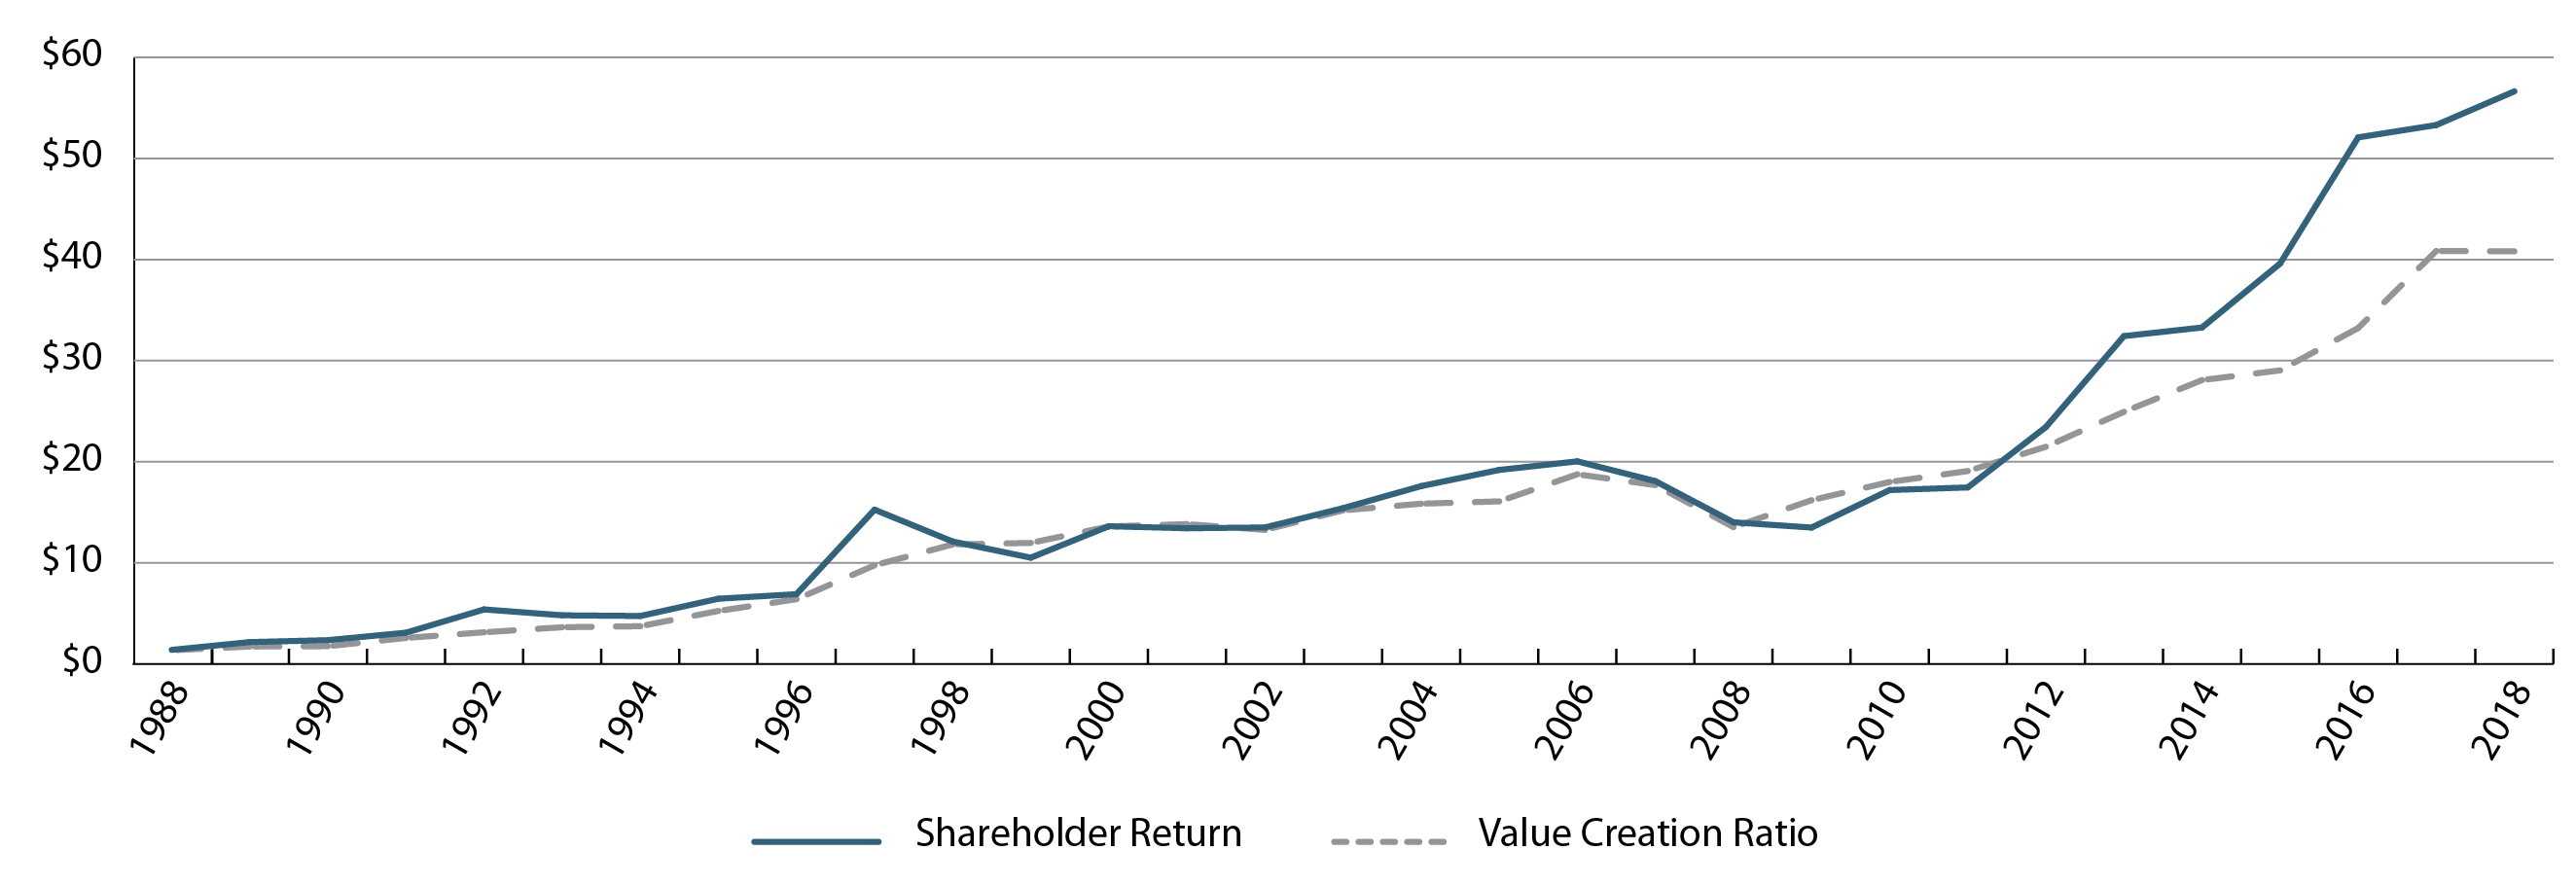
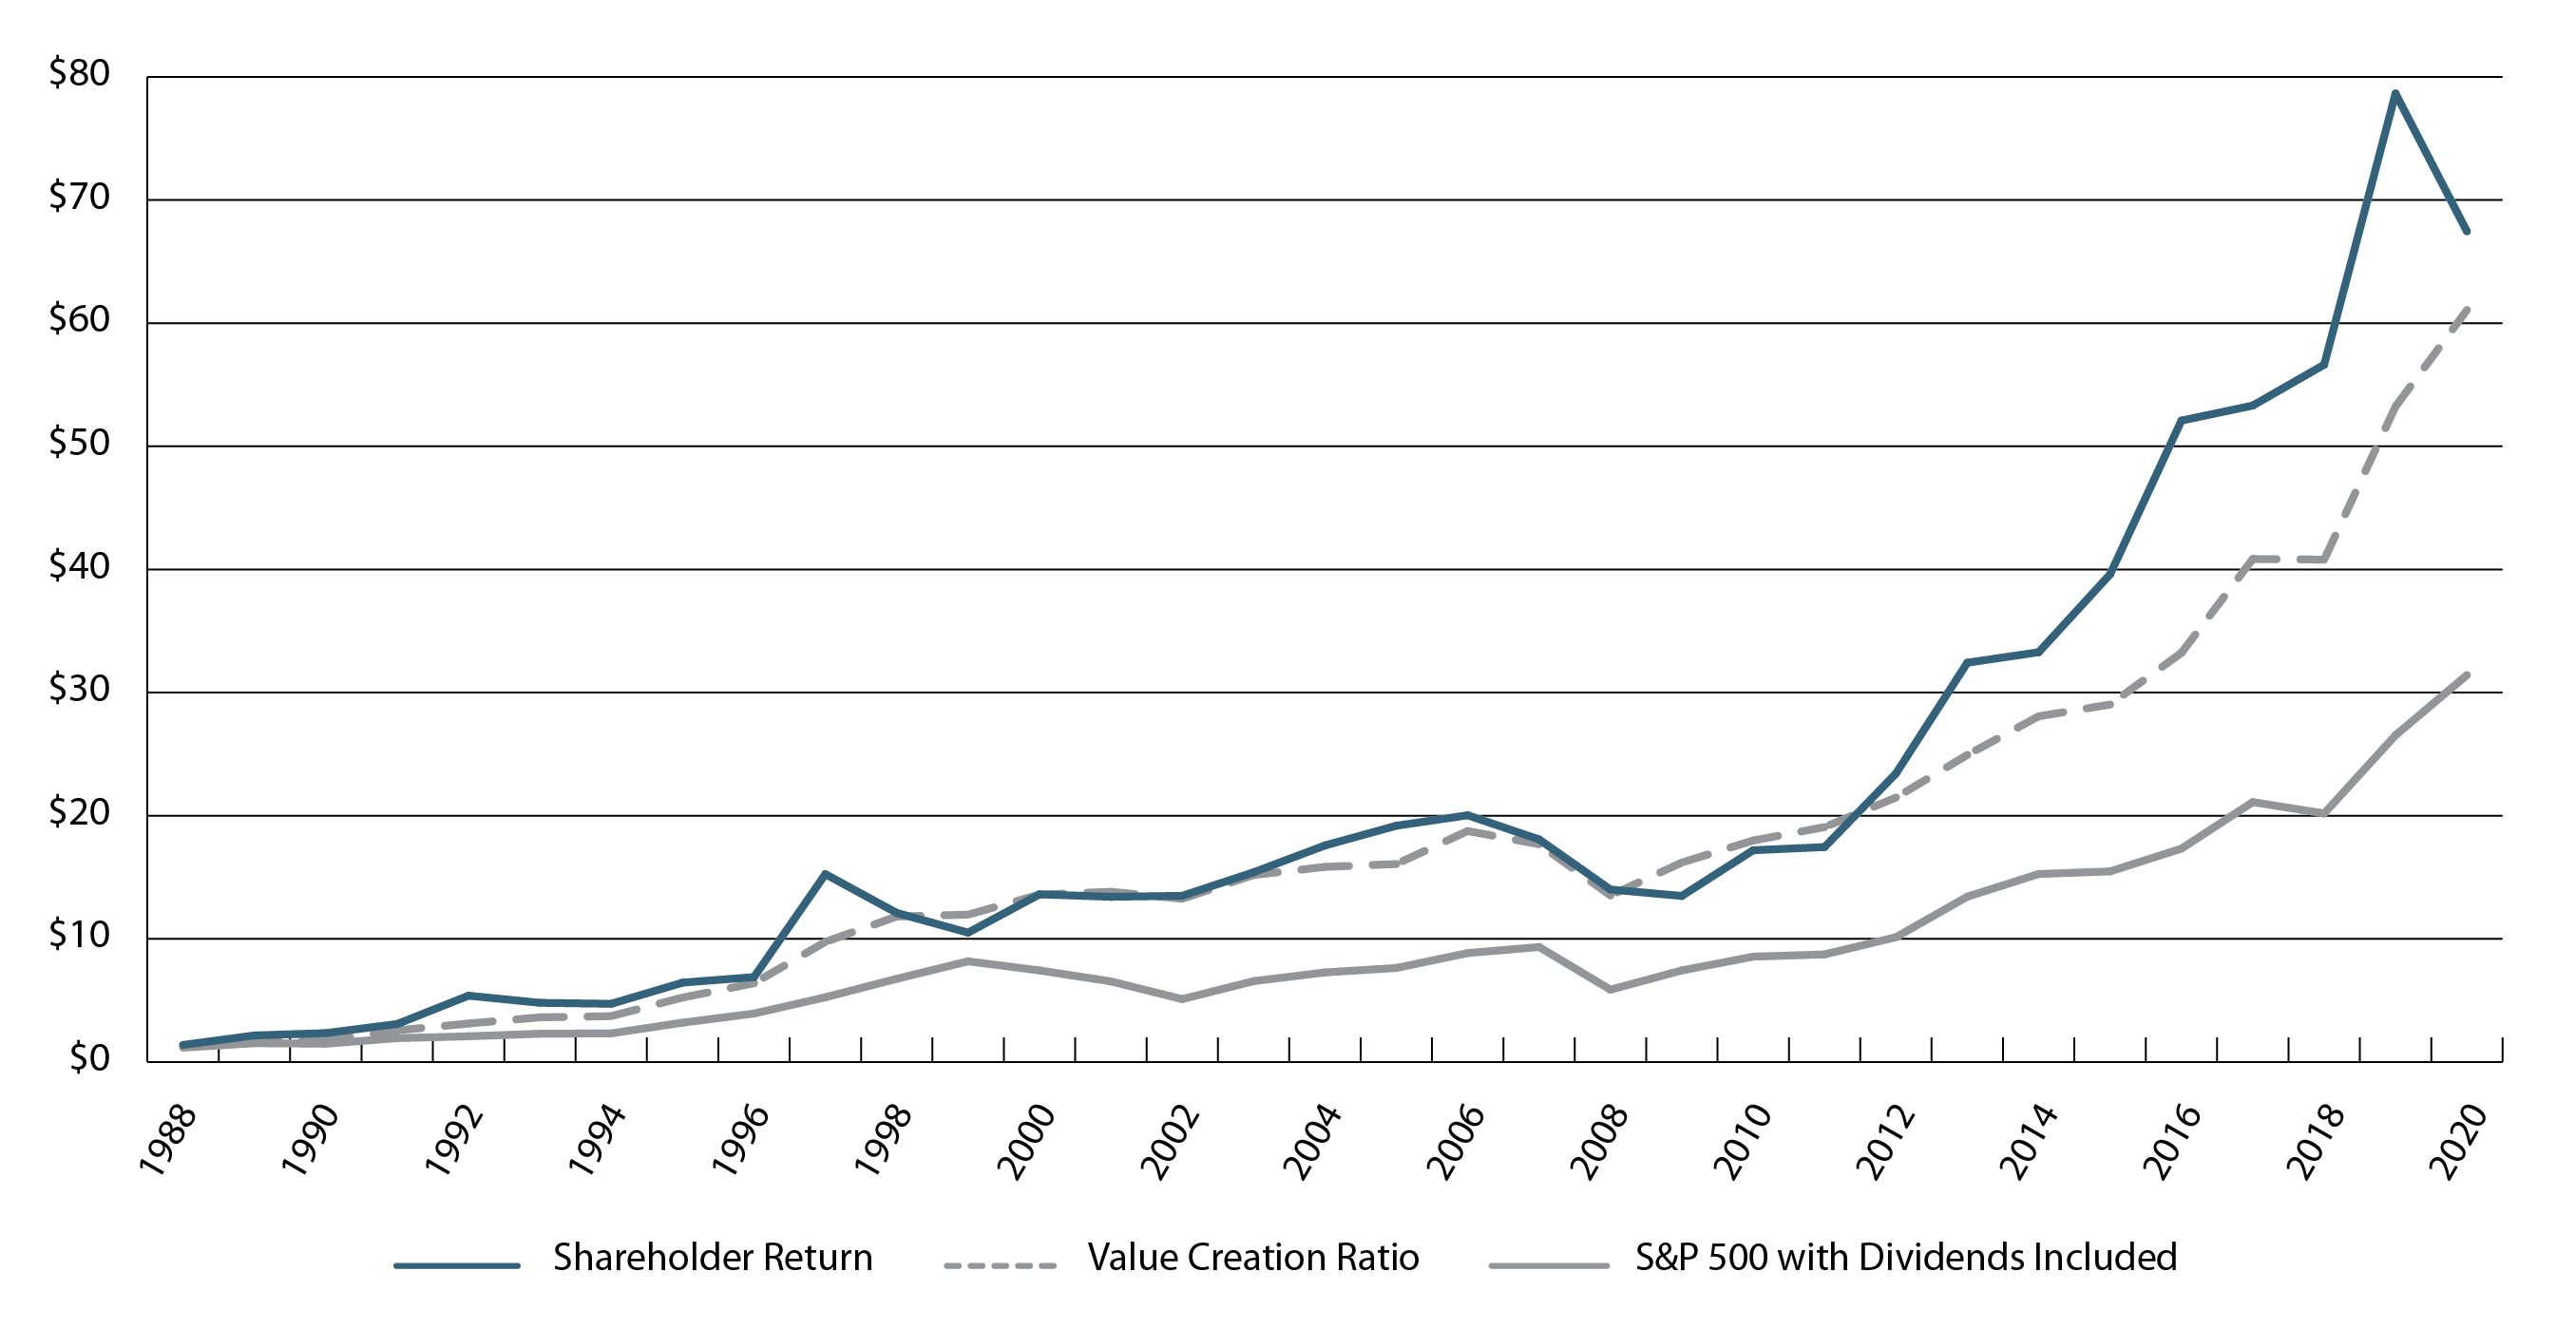 We believe that when we operate our business to achieve a VCR consistently within our targeted range, we create value for shareholders over time, through share price appreciation and dividends paid to shareholders that have increased for
 Relationship Between Company Performance and
Chief Executive Officer Compensation
Generally, the Committee expects that when the company’s performance adds or preserves more value for shareholders than its peers, that compensation for the named executive officers, including the chief executive officer, willshould be higher than when the company’s performance lags its peers. Accordingly, the primary performance metrics for both annual and long-term performance-based compensation are calibrated to the company’s performance compared with the companies in the peer group. At the same
Page 33
time, the Committee expects compensation to directionally correlate with the company’s actual performance for these metrics, particularly when considered over the long term. The following graph illustrates the directional relationships between company performance, based on the two primary performance metrics used in our performance-based awards, and the compensation of our chief executive officer for each of the three years ending 2018.2020.
CEO Pay for Performance
(Dollars in millions)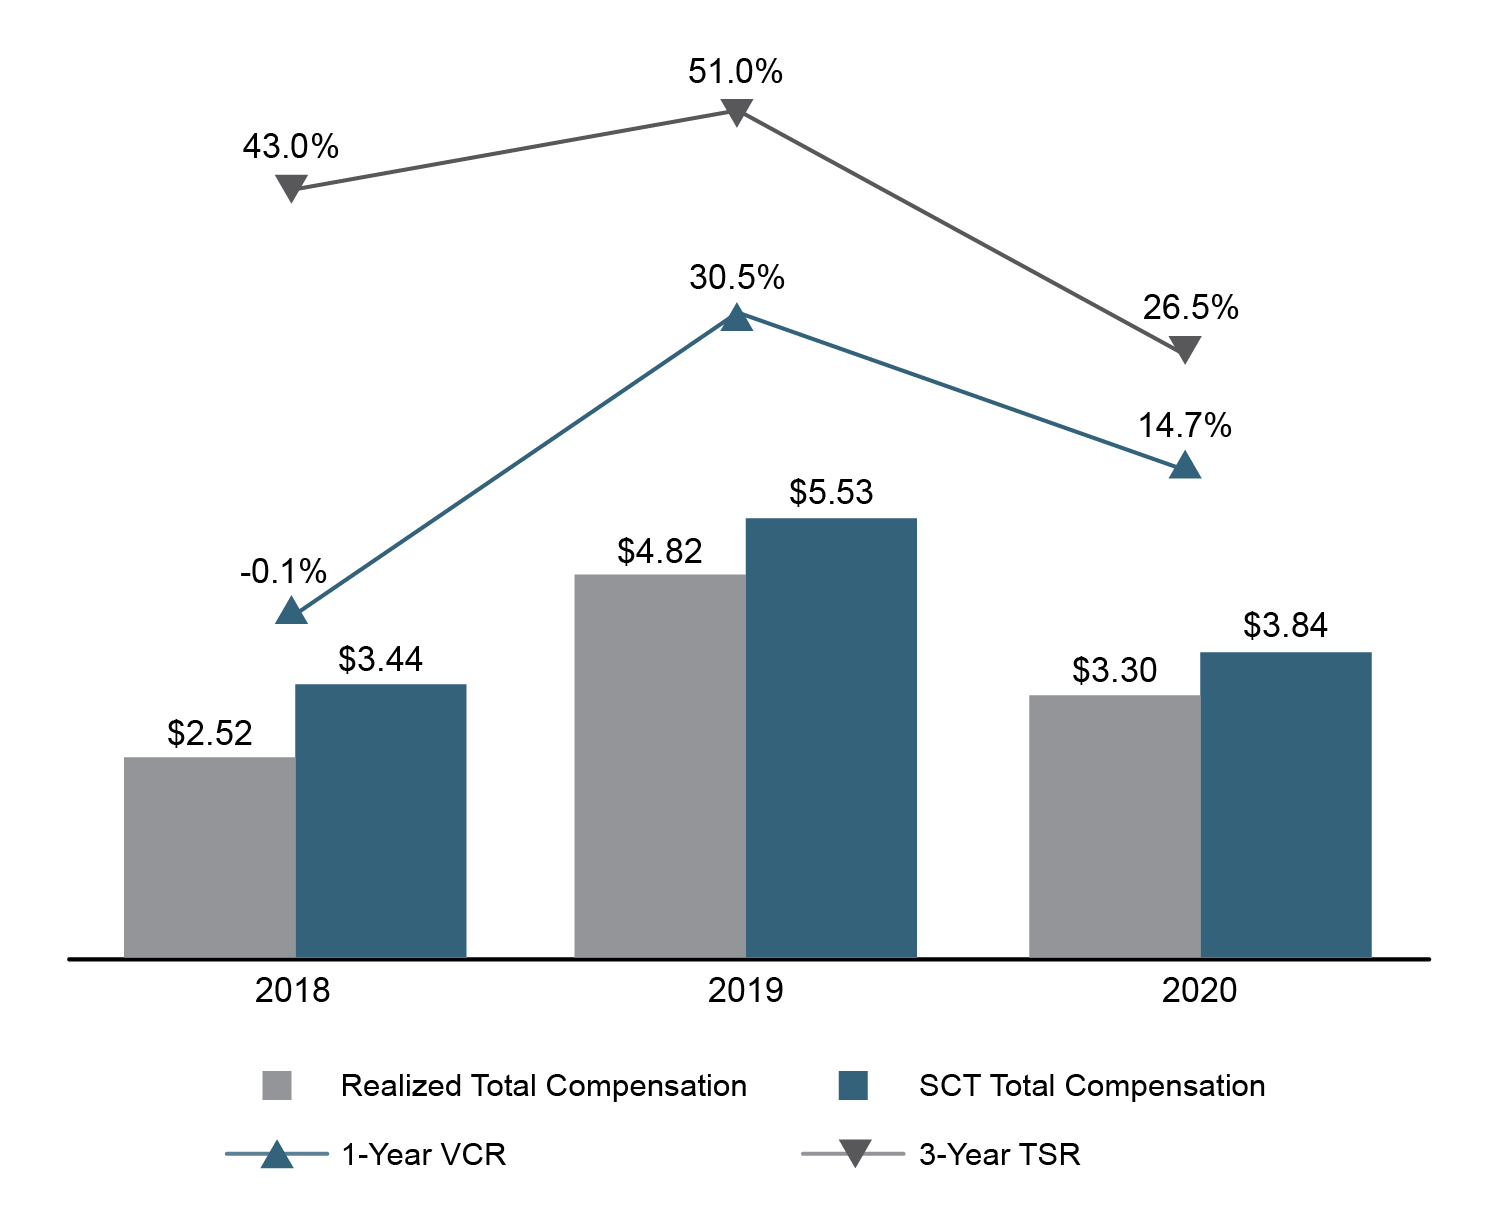
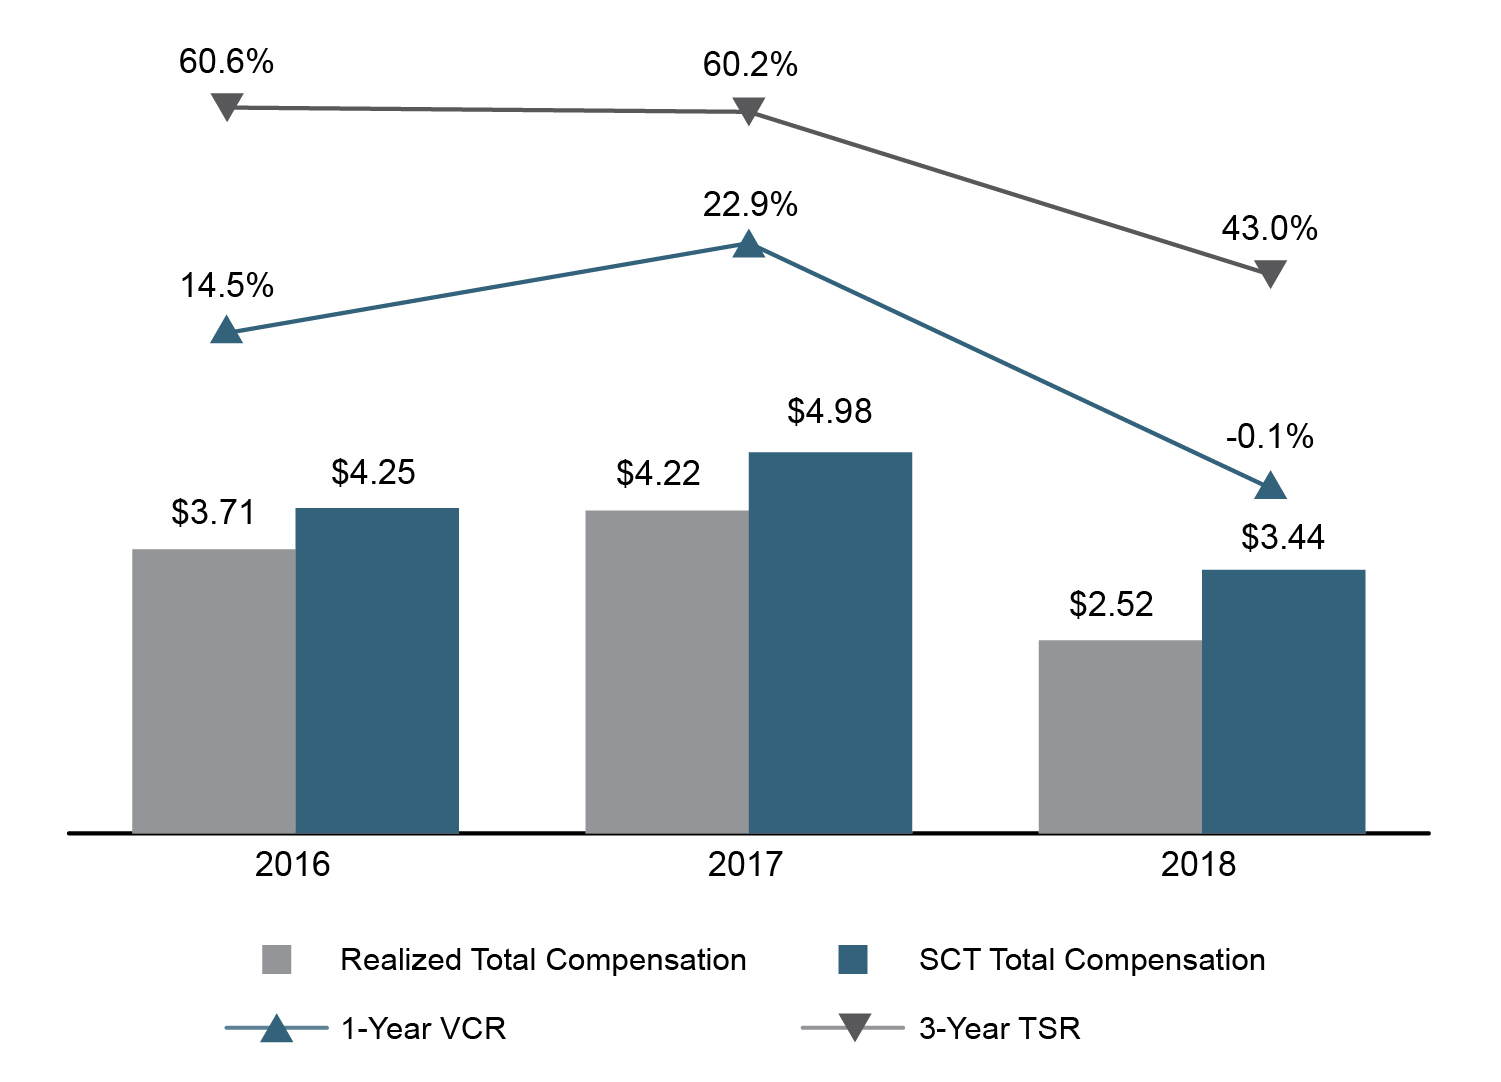
| CEO Pay for Performance | 2018 | 2019 | 2020 | ||||||||||||||
| SCT Total Compensation | $ | 3,444,610 | $ | 5,528,654 | $ | 3,839,784 | |||||||||||
Realized Total Compensation(1) | $ | 2,520,787 | $ | 4,818,669 | $ | 3,304,339 | |||||||||||
| 1-Year VCR | (0.1) | % | 30.5 | % | 14.7 | % | |||||||||||
3-Year TSR(2) | 43.0 | % | 51.0 | % | 26.5 | % | |||||||||||
(1)Realized total compensation is the sum of salary and annual incentive cash compensation reported in the Summary Compensation Table (SCT) for the year plus the value realized from the exercise of stock options and vesting of time-vesting or performance-based restricted stock units, if any, reported in the Option Exercises and Stock Vested table for the year.
(2)3-Year TSR is total shareholder return for the 3-year performance period ending December 31 of a given year, as calculated by and displayed on Bloomberg Finance L.P.
Page 34
| CEO Pay for Performance | 2016 | 2017 | 2018 | ||||||||
| SCT Total Compensation | $ | 4,249,903 | $ | 4,978,956 | $ | 3,444,610 | |||||
Realized Total Compensation(1) | $ | 3,711,998 | $ | 4,217,970 | $ | 2,520,787 | |||||
| 1-Year VCR | 14.5 | % | 22.9 | % | (0.1 | )% | |||||
3-Year TSR(2) | 60.6 | % | 60.2 | % | 43.0 | % | |||||
Over the last three years, compensation for our chief executive officer varied in line with overall company performance, even as the Committee adjusted base annual salary and targets for performance-based compensation. Payouts of annual incentive and long-term performance-based awards throughout the period also directly align with company performance.
Annual Incentive Compensation (VCR) | Long-Term Performance-Equity Compensation (3-Year Total Shareholder Return) | |||||||||||||||||||
| Baseline Award Placement Relative VCR | Adjustments for Growth and Profitability | Final Relative Award Placement* | Performance Level Earned | Performance Relative to Peer Companies | Performance Level Earned | |||||||||||||||
| 2020 | > 4 Peers | None | > 4 Peers | Threshold | > 8 Peers | Maximum | ||||||||||||||
| 2019 | > 8 Peers | +1 | > 9 Peers | Maximum | > 5 Peers | Target | ||||||||||||||
| 2018 | > 3 Peers | None | > 3 Peers | Threshold | > 4 Peers | Threshold | ||||||||||||||
* For the annual performance period ending December 31, 2020, the company's VCR exceeded that of four Peer Group companies. The additional performance goals for net written premium growth and combined ratio were not met and did not affect final award placement or payout.
For the annual performance period ending December 31, 2019, the company's VCR exceeded that of eight Peer Group companies and achievement of the additional performance goals for net written premium growth and combined ratio were met and increased relative peer placement by one, but did not affect award payout.
For the annual performance period ending December 31, 2018, the company's VCR exceeded that of three Peer Group companies. The additional performance goals for net written premium growth and combined ratio were not met and did not affect final award placement or payout.
Page 35
Our performance over the last three years exceeded foureight of the nine companies of our peer group as measured by three-year total shareholder return. As suggested by the Three-Year Relative Pay for Performance graph below, total realizable compensation1 for our chief executive officer and the other named executive officers over the same period remains comparatively low, ranking nearbelow the 28th percentile,median of the peer group, largely reflecting the size of several of the companies included in the peer group. While we do not benchmark executive compensation to the peer group, we do compare our performance is judged against those companies, with whomregardless of their size, because we compete against them every day for each insurance policy we write, regardless of the size of those companies.write.
Three-Year Relative Pay for Performance
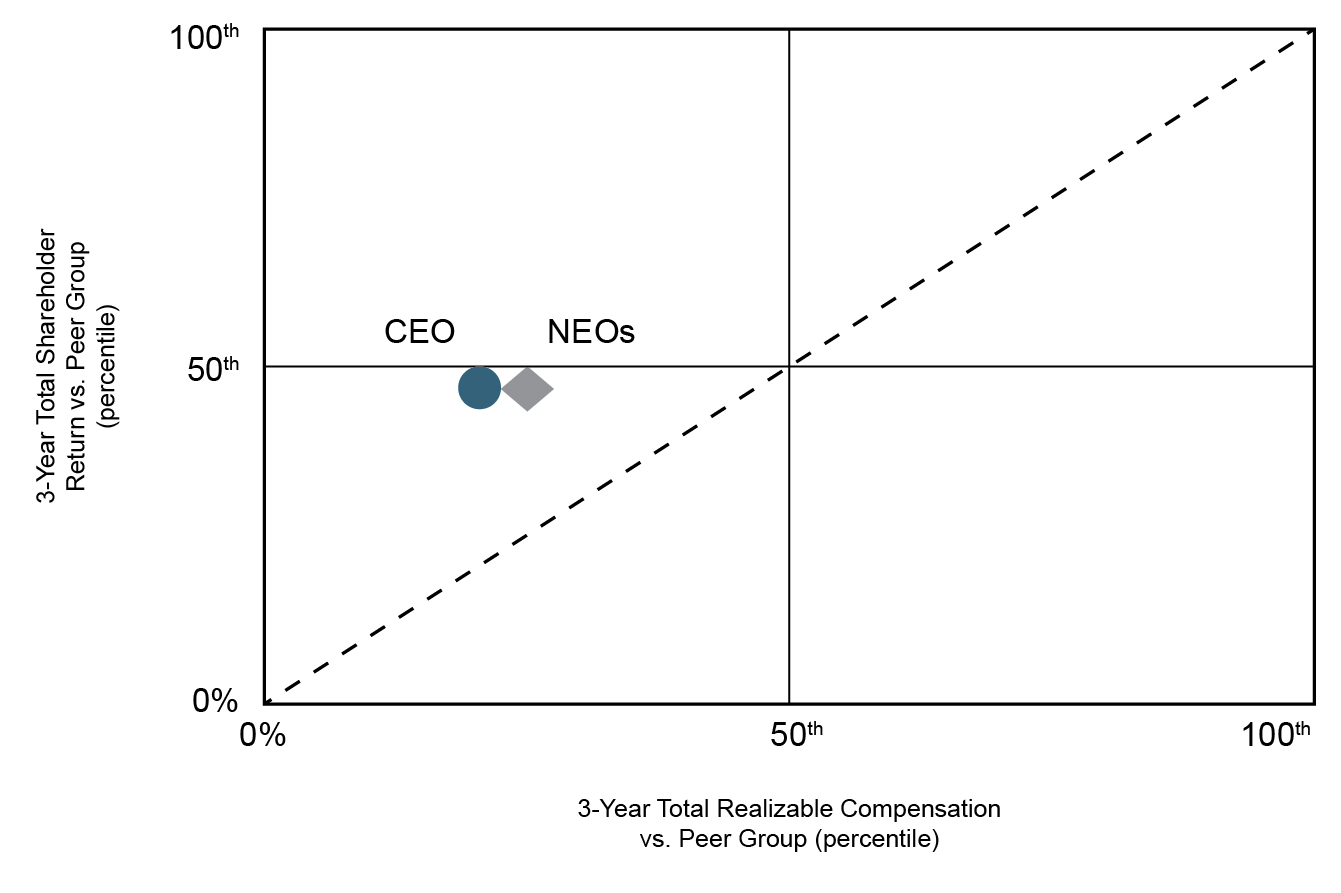
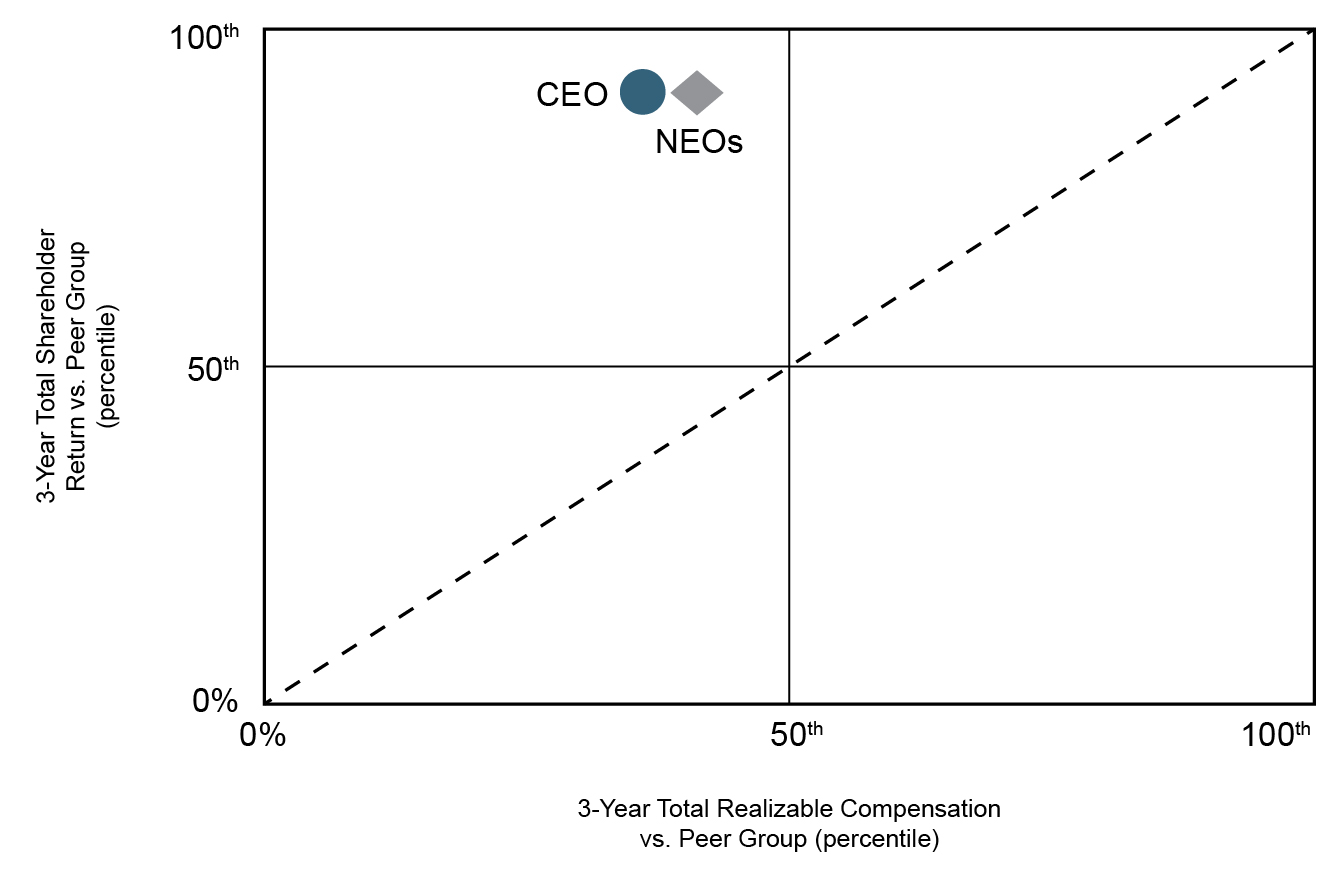
________________________
Page 36
Results of 20182020 Advisory Vote to Approve Executive Compensation
At the 20182020 Annual Meeting of Shareholders, more than 96 percent95% of the votes cast were in favor of this proposal. The Committee believes this favorable outcome demonstrates support of its decisions and of our overall executive compensation program. Our annual discussions with investors confirm this belief. All of the shareholders contacted during our annual investor engagement efforts in 20182020 favorably commented on the company’s executive compensation program, criteria for performance-based awards and overall level of pay. The Committee made no material changes in the structure of our compensation program in 20182020 as a result of feedback from investors. At the 20192021 Annual Meeting of Shareholders, we will again hold an advisory vote to approve executive compensation (see Page 31)30). The Committee will continue to consider the results of these annual advisory votes and feedback from investor outreach in its deliberations about our executive compensation program.
Page 37
Executive Compensation Practices
The Committee applies certain fundamentals that are key characteristics of our overall compensation program, including:
| We Do | We Don’t | ||||||||||
| ü | Link Pay to Performance - The majority of pay awarded by the Committee to each executive officer each year is tied to achievement of short- and long-term performance objectives and changes in the market value of the company’s common stock. | û | Use Employment Contracts - We employ all of our executive officers at will. | ||||||||
| ü | Review Data Sheets - Each year the Committee reviews data recounting the compensation history for each executive officer. For the named executive officers, the Committee additionally reviews compensation and performance data for the companies in the peer group before making executive compensation decisions. | û | Benchmark Executive Compensation - We review compensation program structures and resulting payouts of the companies in our Peer Group to maintain an awareness of pay levels and practices. We do not benchmark the compensation we pay our named executive officers to achieve a specific level of pay, for example "above the median" of our Peer Group. | ||||||||
| ü | Mitigate Excessive Risk - Compensation earned from performance-based awards is capped and is subject to clawback policies and provisions. Company-level performance objectives relative to peers minimizes the ability of any single individual or business unit to control its own performance-based compensation. The Committee’s authority to exercise negative discretion and eliminate payment of any award also is a powerful risk control. | û | Pay Dividends or Dividend Equivalents - We do not pay dividends or dividend equivalents on unvested stock awards. | ||||||||
| ü | Use Double-Trigger Change in Control Provisions - Both our annual incentive and stock-based compensation plans include double-trigger change in control provisions. | û | Reprice or Exchange Stock Options - We do not reprice or exchange stock options. We consider stock options to be performance-based compensation that links the financial success of our associates to shareholders. Since shareholders cannot reprice or exchange their shares, neither do we. | ||||||||
| ü | Perform Compensation Risk Assessments - Our chief risk officer performs this assessment each year, and it is considered by the Committee as part of its decision making process. | û | Include Stock-Based Awards in Calculations for Pension or Other Retirement Benefits - Our pension is calculated based on salary only, and our matches to 401(k) and Top Hat Savings Plan contributions are limited to cash compensation. | ||||||||
| ü | Track Compliance with Ownership Guidelines - All of our directors and executive officers are in compliance with our published stock ownership guidelines. | û | Allow Hedging Transactions by Executive Officers or Directors - Our Securities Trading Policy prohibits transactions such as short sales, prepaid forward sales contracts or other hedging transactions that we believe decouple the director’s or officer’s interests from those shared by our shareholders generally. | ||||||||
Historically, the Committee has avoided making adjustments to the executive compensation program for unusual events in any performance period. The Committee's view is that the executive officers are responsible for appropriately managing the company through all circumstances and that from time to time external events may occur that have the effect of helping or hindering the operational and financial results in any given year. In 2020, the Committee maintained that practice, despite the potential for economic effects of the coronavirus pandemic to negatively affect the company's operations or financial performance. Accordingly, the Committee's decisions for compensation of the company's executive officers made in February 2020, before the declaration of the coronavirus pandemic, including
Page 38
performance objectives and targets for the various elements of performance-based compensation, were not adjusted.
Components of Compensation
Total direct compensationDirect Compensation (TDC) is the compensation annually determined or awarded each year by the Committee. TDC generally is the sum of three components: base annual salary, target levels of annual incentive cash compensation and long-term equity compensation comprised of target levels of performance-based and service-based equity compensation. As illustrated in the following charts, in 2018,2020, approximately 69 percent70% of TDC awarded to the chief executive officer and 56 percent56% of the TDC awarded to the other named executive officers was considered performance-based and not guaranteed.at risk.
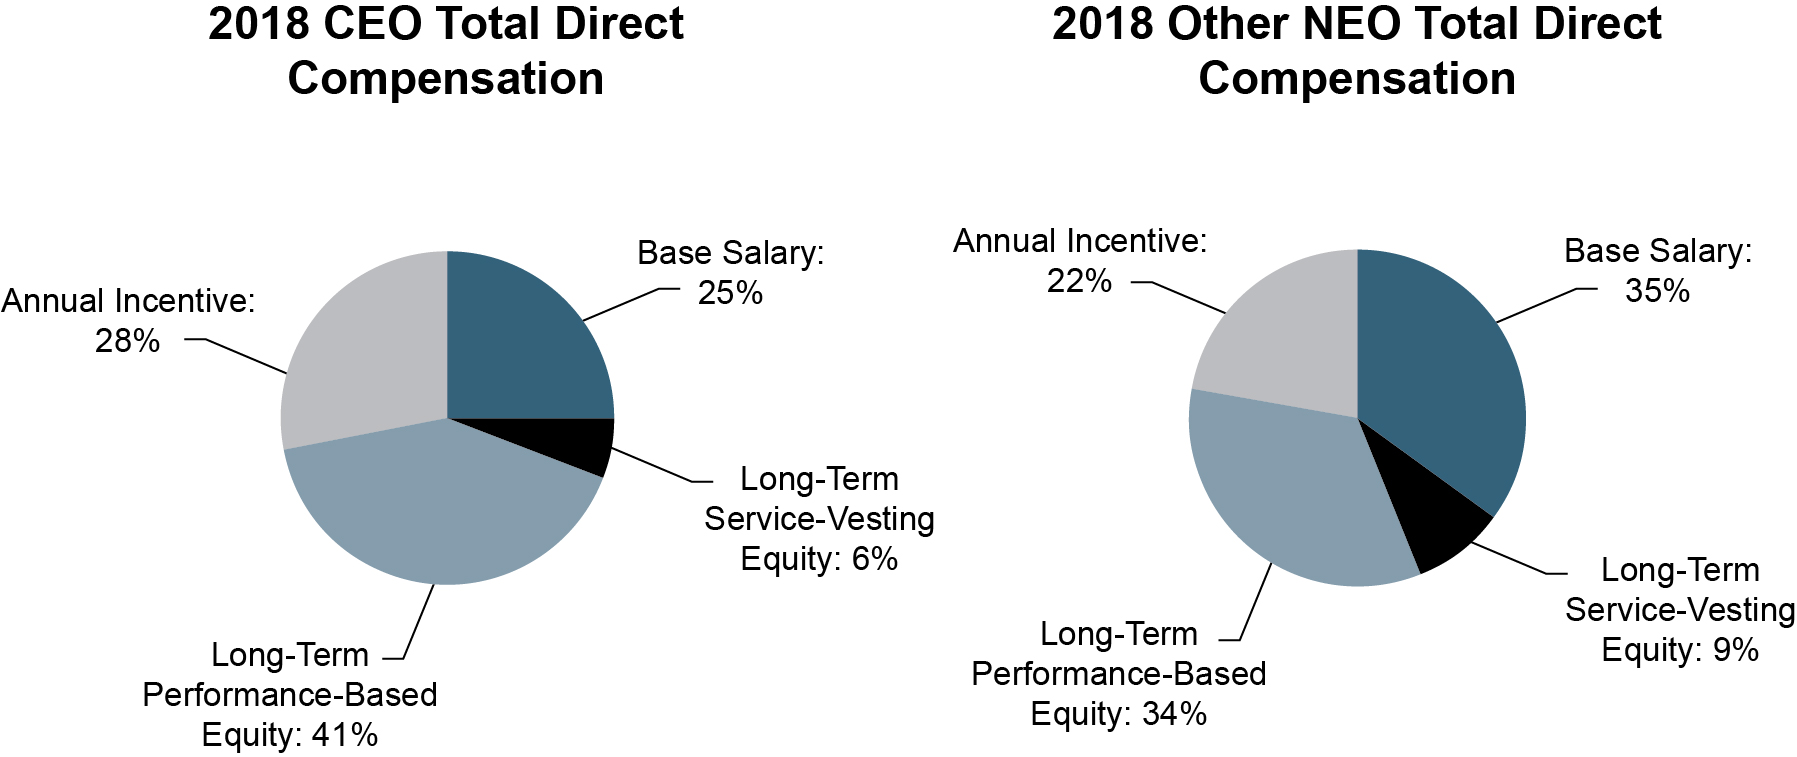
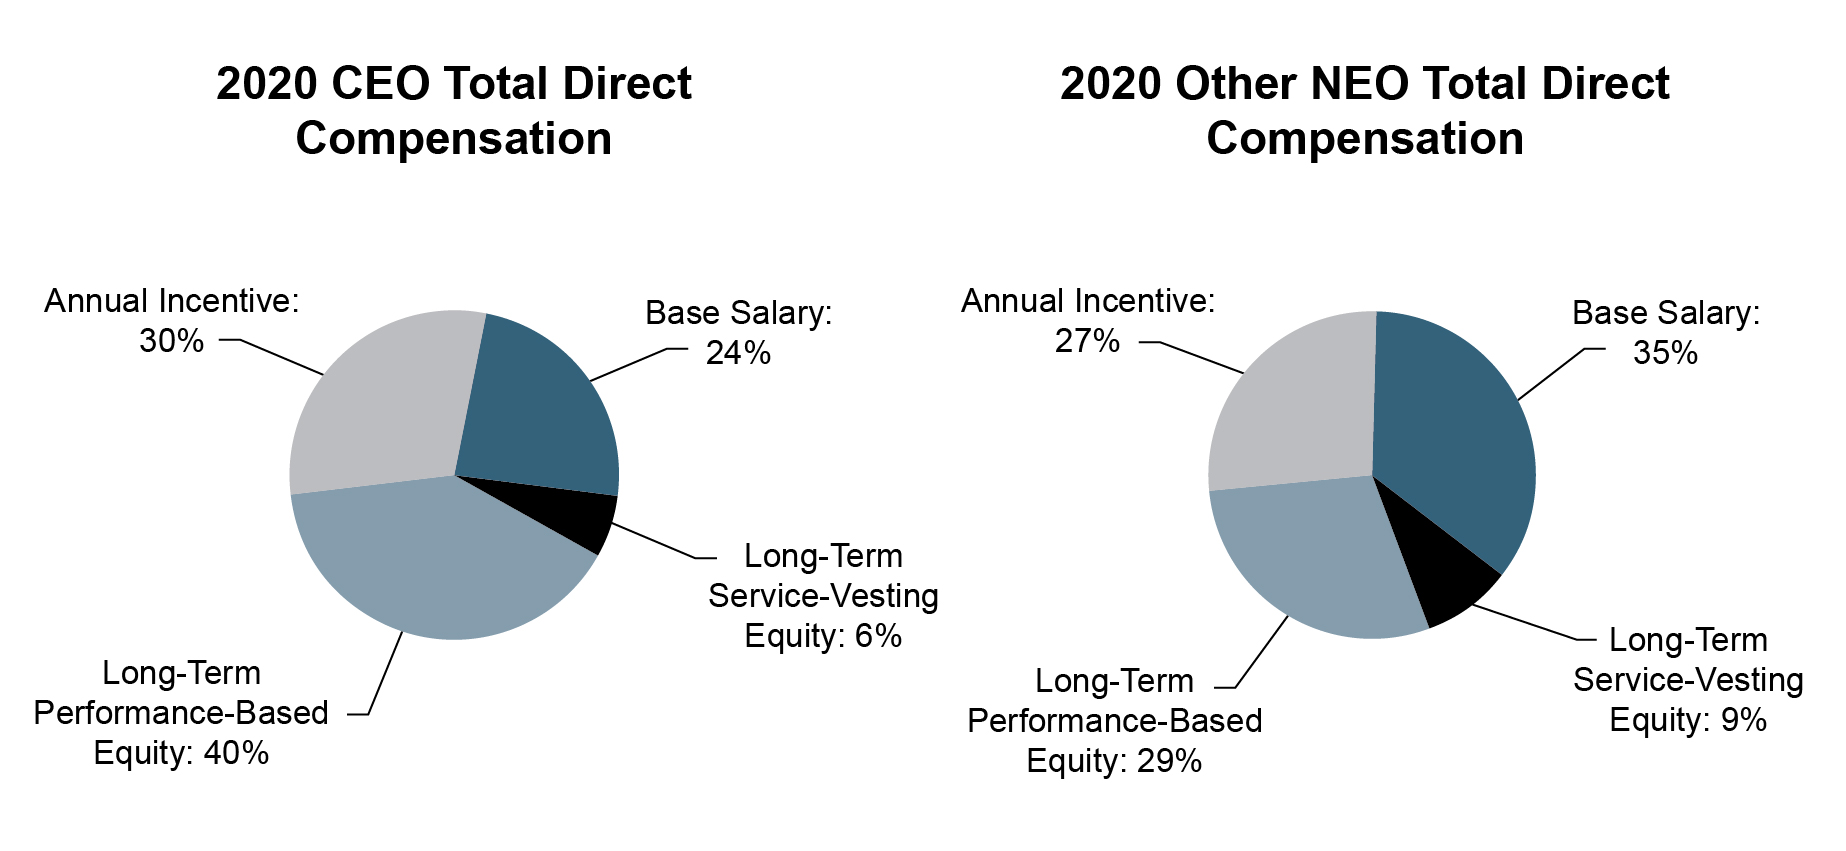
Base Annual Salary
We use base annual salary to attract executive talent and to provide adequate and stable compensation. The Committee reviews and sets base annual salaries for the named executive officers each year. In determining base annual salary, the Committee considers:
•The officer’s role and responsibilities,
•Fairness, as compared with officers with similar responsibilities, experience and performance,
•Current compensation level, and
•Individual performance.
Base annual salaries may be adjusted to reflect annual merit increases, if any; promotions or changes in role or responsibilities; and market adjustments.
The base annual salaries for the named executive officers were adjusted in February 20182020 to recognize the strong individual contribution of each officer to the company’s strong performance in the prior year.year, and additionally for Mr. Spray, for increased job responsibilities. On average, base annual salary for the group increased approximately 4.5 percent.5%. On an individual basis, each named executive officer’s salary was adjusted as follows:
•For Mr. Johnston, an increase of 3.0 percent3.0% to $1,030,000;$1,093,800;
•For Mr. Sewell, an increase of 5.0 percent3.0% to $857,500;$910,700;
•For Mr. Hollenbeck, an increase of 5.0 percent3.0% to $715,804; and$760,200;
•For Mr. Mullen, an increase of 8.5 percent3.0% to $624,445.$663,200;
Page 39
•For Mr. Kellington, an increase of 4.0% to $622,700; and
•For Mr. Spray, an increase of 16.0% to $727,100.
Annual Incentive Compensation
We payuse annual incentive compensation to encourage achievement of key short-term performance objectives believed to be important for achievement of longer-term strategic goals. Under the shareholder-approved Annual Incentive Compensation Plan of 2009, as amended (2009 Annual Incentive Plan), each executive officer is eligible to annually receive an award of up to $3 million in cash for 2020 based on achievement of specific performance-based criteria.
The 2009 Annual Incentive Plan offers a wide range of performance objectives from which the Committee may choose. The specific performance objectives, hurdles and targets for each year are contained in the award agreements delivered to the individual officer. The 2009 Annual Incentive Plan also features a forfeiture and recoupment provision to enable the company to recover payments under this plan when circumstances warrant. Awards of incentive compensation tie vesting of a portion of annual cash compensation to performance goals.
Performance Objectives
The Committee uses a multi-metric formula that incorporates three performance objectives. The primary performance objective is our one-year value creation ratio (VCR)VCR relative to our peer group. We believe this measure captures the contribution of our insurance operations, the success of our investment strategy and the importance we place on paying cash dividends to shareholders. The value creation ratio is a two-part metric: 1) our rate of growth in book value per share, plus 2) the ratio of dividends declared per share to beginning book value per share. We are targeting an annual VCR averaging 10 percent10% to 13 percent13% over the nextany five-year period. Two company-specific performance objectives also are used by the Committee to emphasize the importance of consistent profitable growth. These company-specific performance objectives are:1) revenue as measured by property casualty net written premium growth (premium growth goal), and 2) underwriting profitability as measured by the combined ratio (combined ratio goal). When both operating goals of premium growth and combined ratio are achieved, the company's relative placement among the peer group companies may be improved by up to threefour placements to determine the final award placement. For the named executive officers, the maximum effect of the addition of these two performance objectives is capped at one additional payout level, for example from a threshold to a target-level payout, but not from a threshold to a maximum-level payout.
Setting Target Amounts
Target amounts for annual incentive compensation are set by the Committee each year as a percentage of the named executive officer’s salary. In 2018,2020, the percentage of salary ranged from 65 percent75% to 110 percent125% based on the named executive officer’s tier. Assignment to a particular tier was based on level of responsibility. In 2018,2020, Mr. Johnston was assigned to the chief executive officer’s tier for which the target-level award was 110 percent125% of base annual salary. The remaining named executive officers were assigned to Tier I for which target-level awards were 65 percent75% of base annual salary.
Page 40
Determining Final Award Placement
Determination of the final award placement is a three-step process:
•Step 1 - The Committee determines the company's baseline award placement among the peer group companies based on relative VCR. As in prior years, when the company's VCR exceeds the VCR of one or more of the companies in the peer group, the company's baseline award placement increases by one for each peer group company exceeded.
•Step 2 - The Committee determines whether the company achieved the pre-establishedpreestablished premium growth goal. For 2018,2020, the growth goal was 2.0 percent3.0% or more. If the company does not achieve the growth goal, then the final award placement is the baseline award placement determined in Step 1. If the growth goal is achieved, then the final award placement is determined by Step 3.
•Step 3 - The Committee determines the achievement of the final award placement based on achievement of the combined ratio goal. The combined ratio goal for 20182020 awards is as follows:
◦When the combined ratio is 97.0% or better, the company's baseline award placement improves by one placement.
◦When the combined ratio is 95.0% or better, the company's baseline award placement improves by two placements.
◦When the combined ratio is 93.0% or better, the company's baseline award placement improves by three placements.
◦When the combined ratio is 91.0% or better, the company's baseline award placement improves by four placements.
If the company does not achieve the combined ratio goal, then the final award placement is the baseline award placement determined in Step 1.
Setting Performance Hurdles
Performance hurdles for threshold, target and maximum awards were set at the 30th, 50th and 75th percentiles, respectively, of the peer group. Stated another way, the final award placement must exceed three of the nine peer companies to achieve the threshold hurdle, must equal or exceed five peer companies to achieve the target hurdle and must equal or exceed seven peer companies to achieve the maximum hurdle. Achievement of threshold, target and maximum performance hurdles earns award payouts of 30 percent, 100 percent30%, 100% and 200 percent,200%, respectively, of target. If the final award placement does not exceed at least three of the peer companies, no annual incentive compensation is earned or paid.
Page 41
Calculating the Annual Incentive Award Earned
Step 1: Determining the Baseline Award Placement Using Relative VCR
As shown in the following chart, for 2018,2020, the company achieved a value creation ratioVCR of -0.1 percent,14.7%, which exceeded the value creation ratioVCR achieved by threefour peer group companies. This established the baseline award placement of exceeding threefour peer companies.
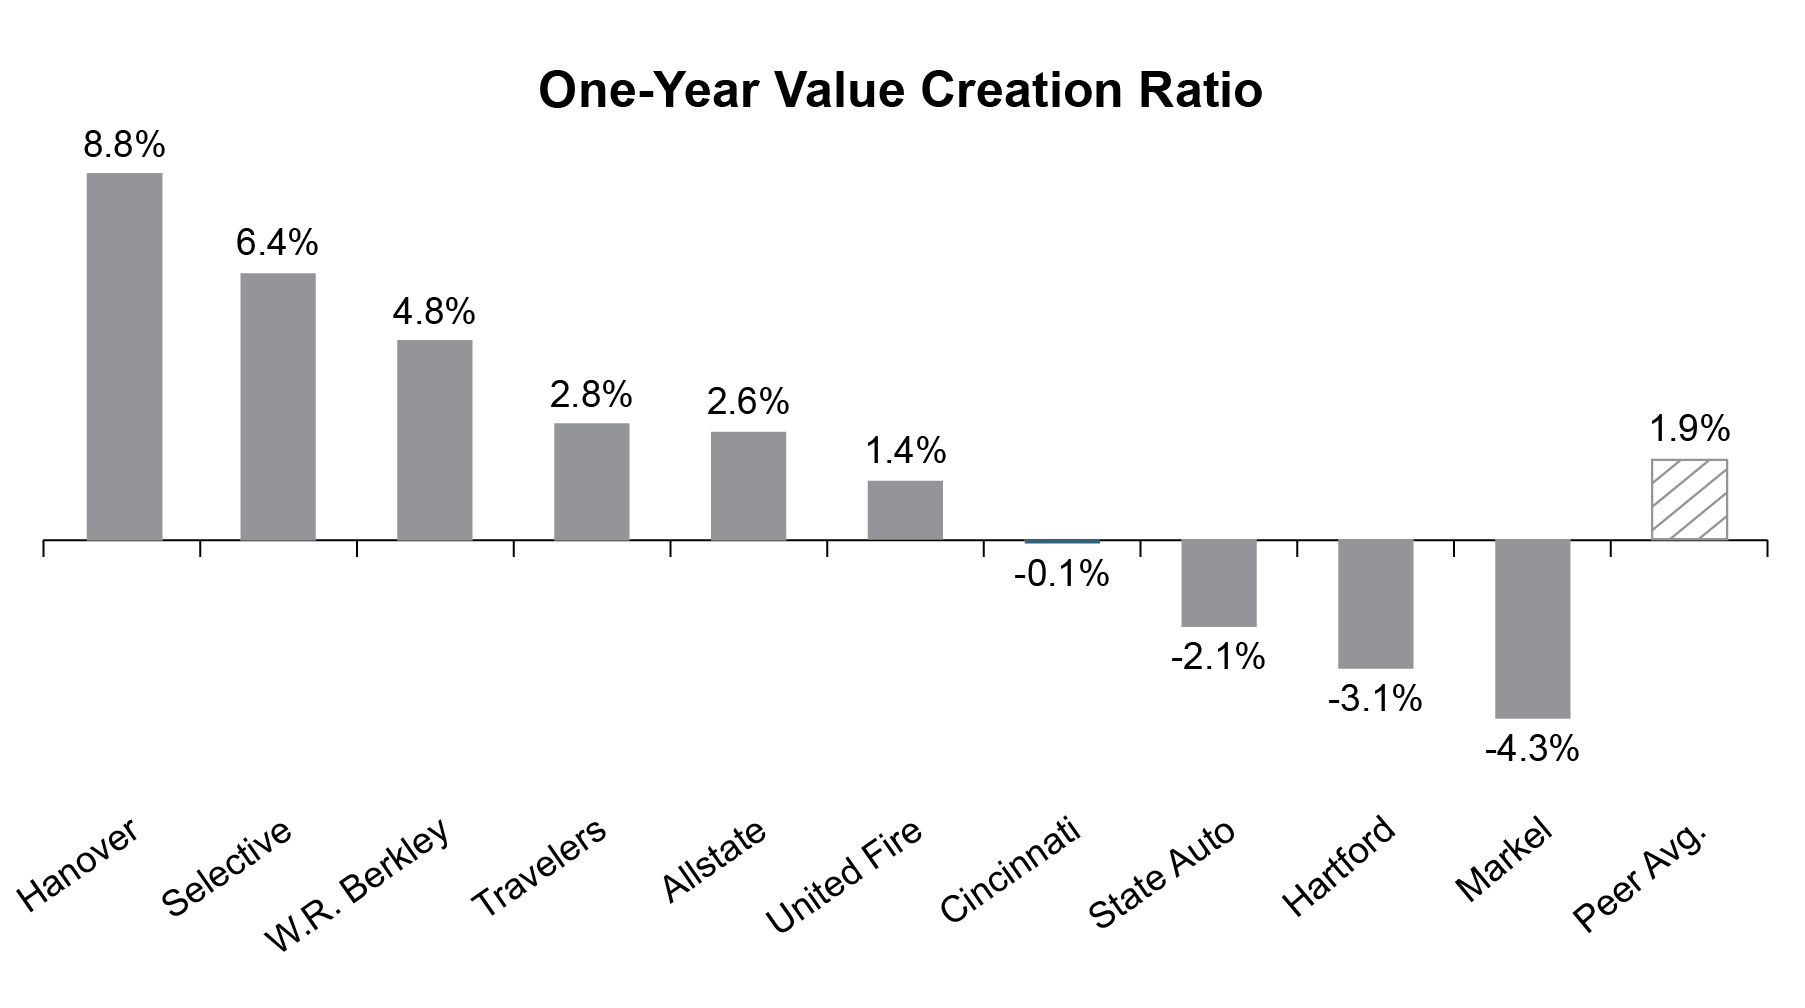
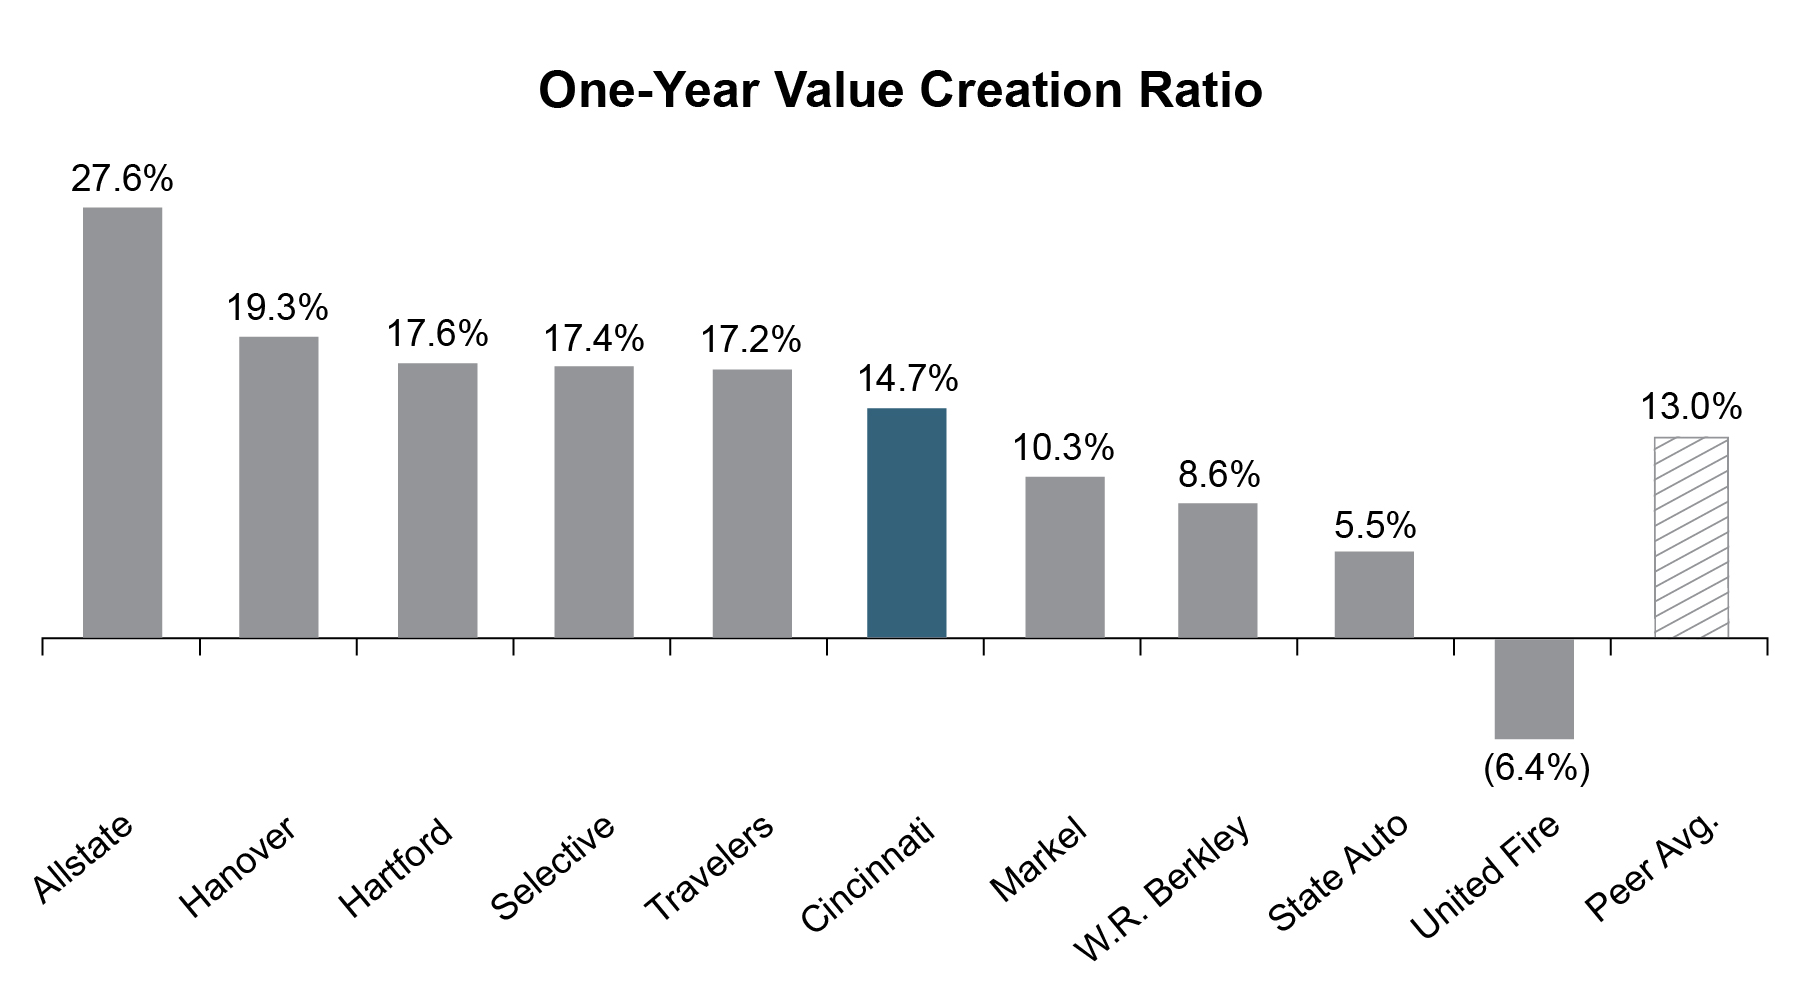 Step 2: Determining Achievement of Premium Growth Goal
The premium growth goal for awards granted in 20182020 was 2.0 percent3.0% or more. The company reported property casualty net written premium growth of 4.0 percent, satisfying6.0%, exceeding the 20182020 premium growth goal.
Step 3: Determining Achievement of Combined Ratio Goal
The company reported a property casualty combined ratio of 96.4 percent,98.1%, which failed todid not satisfy the combined ratio goal.
Page 42
The following formula is used to calculate the annual incentive award earned:
Base Annual Salary X Tier Target % X Performance Factor (0 - 200%)
The following table shows how the formula was applied and the actual amounts earned for 2018.2020.
| Name | Base Annual Salary ($) | Tier Target % of Base Annual Salary | 2020 Performance Factor (Threshold) (%) | 2020 Annual Incentive Cash Compensation ($) | ||||||||||
| Steven J. Johnston | 1,093,800 | 125 | 30 | 410,175 | ||||||||||
| Michael J. Sewell | 910,700 | 75 | 30 | 204,907 | ||||||||||
| Martin F. Hollenbeck | 760,200 | 75 | 30 | 171,045 | ||||||||||
| Martin J. Mullen | 663,200 | 75 | 30 | 149,220 | ||||||||||
| John S. Kellington | 622,700 | 75 | 30 | 140,107 | ||||||||||
| Stephen M. Spray | 727,100 | 75 | 30 | 163,597 | ||||||||||
| Name | Base Annual Salary ($) | Tier Target % of Base Annual Salary | 2018 Performance Factor (Threshold) (%) | 2018 Annual Incentive Cash Compensation ($) |
| Steven J. Johnston | 1,030,000 | 110 | 30 | 339,900 |
| Jacob F. Scherer, Jr. | 953,424 | 65 | 30 | 185,918 |
| Michael J. Sewell | 857,500 | 65 | 30 | 167,213 |
| Martin F. Hollenbeck | 715,804 | 65 | 30 | 139,582 |
| Martin J. Mullen | 624,445 | 65 | 30 | 121,767 |
Long-Term Stock-Based Compensation
General
We award stock-based compensation not only to reward service to the company, but also to provide incentive for individuals to remain in the employ of the company and help it prosper. We believe people tend to value and protect most that which they have paid for, generally by investing their time, effort or personal funds. Over the long run, we believe shareholders are better served when associates at all levels have a significant component of their financial net worth invested in the company. For that reason, we grant awards of stock-based compensation not only to our directors and to named executive officers, but also generally to all full-time salaried associates of the company who are in good standing. We believe this approach encourages associates at all levels to make decisions in the best interest of the company as a whole, linking their personal financial success with the company’s success. Although we do not have access to information about broker accounts, we estimate that approximately 80 percent80% of our current associates hold shares of Cincinnati Financial Corporation. Stock ownership guidelines applicable to all directors and officers help the Committee monitor ownership for all directors and officers. Our Director and Officer Stock Ownership Guidelines can be found at cinfin.com/investors.
Stock-based awards granted to all associates in February 2018,2020, totaled less than 1 percent1% of total shares outstanding. In 2018,2020, on an after-tax cost basis approximately 43 percent29% of all stock-based awards were granted to the company’s executive officers, including the named executive officers, and approximately 57 percent71% were granted to nearly 3,6003,900 other company associates. All stock-based awards are granted at 100 percent100% of fair value on the date of grant.
Page 43
Types of Stock-Based Awards
The Committee grants three types of stock-based awards to the named executive officers: nonqualified stock options, performance-based restricted stock units (PSUs) and service-vesting restricted stock units (RSUs). The Committee finds these awards effective because stock options have value only if there is a corresponding increase in value recognized by shareholders, while PSUs focus executives on the sustained long-term performance of the company regardless of short-term stock price fluctuations. RSUs further emphasize the long-term focus and strengthen the alignment of financial interests shared by executives and shareholders, and supports retention of executive talent. Both stockStock options and PSUs granted prior to November 2, 2017, were intended to qualify as performance-based, tax-deductible executive compensation. The named executive officers also are eligible to receive shares under the Holiday Stock Plan. We do not pay dividends or dividend equivalents on unvested stock-based awards.
Stock Options - For the named executive officers, the Committee uses nonqualified stock options that vest and become exercisable in equal amounts over the three years following the grant date. We consider stock options to be performance-based compensation, because the associate recognizes value only if the market value of our stock appreciates over time. Stock options tie the compensation realized from such awards, if any, to changes in the stock price experienced by shareholders. When the stock price does not increase, the stock options do not have value. We do not, and have not, backdated, repriced or exchanged stock options.
PSUs - For the named executive officers, the Committee uses PSUs that cliff vest after three years if performance targets are achieved. PSUs tie vesting of a portion of stock-based compensation to performance goals, and the three-year performance period for awards of PSUs reinforces the company’s long-term focus and matches the period after which stock option awards are fully vested and exercisable. If performance hurdles are achieved and an award of PSUs vests, the award is paid in shares of common stock, one share for each restricted stock unit. For PSUs, the Committee expects to set targets that it considers achievable, but that require some stretch, based on market conditions and the current insurance industry environment at the time of grant.
Since November 2008, the performance objective for PSUs has been three-year total shareholder return relative to the companies in the peer group. The Committee selected this measure because total shareholder return combines share price appreciation and dividends paid. It measures the total return achieved for the shareholder and the relative position reflects the market perception of overall performance relative to the peer group.
RSUs - For the named executive officers, the Committee uses RSUs that ratably vest in thirds over three years. The Committee uses RSUs as a regular component of compensation for the named executive officers to place additional emphasis on long-term compensation, aid retention and strengthen the alignment of executive officer and shareholder financial interests.
Page 44
Setting Target Amounts for Stock-Based Awards
Target amounts for performance-based stock compensation (nonqualified stock options and PSUs) are set by the Committee as a percentage of the named executive officer’s salary. For 2018,2020, the percentage of salary ranged from 97.5 percent97.5% to 165 percent (which amounts are 150 percent of annual incentive targets)165% based on the named executive officer’s tier. Assignment to a particular tier was based on level of responsibility. In 2018,2020, Mr. Johnston was assigned to the chief executive officer’s tier for which the target level award was 165 percent165% of base annual salary. The remaining named executive officers were assigned to Tier I for which target level awards were 97.5 percent97.5% of base annual salary. The target dollar amount is then allocated between stock options and PSUs. The number of stock options granted is determined by dividing the target dollar amount by the intrinsic value of the stock option on the date of grant. That intrinsic value represents an estimate of fair value of each stock option granted, based on a modeled future market price of our stock less the exercise price applicable to that stock option. For option grants issued during 2018,in February 2020, that intrinsic value was $10.02$15.55 per share. Assumptions related to that value are disclosed in our 20182020 Annual Report on Form 10-K note that describes share-based associate compensation plans. The number of PSUs granted is determined by dividing the target dollar amount by the grant date fair value of the company’s stock, which is determined by the average of the high and low sales price on Nasdaq on the date of grant. For 2018,PSUs granted in February 2020, the target value for stock awards was allocated 50 percent50% to PSUs and 50 percent50% to stock options. The following formulas were used to calculate the number of shares underlying the grants of performance-based stock compensation:
For nonqualified stock options:
| Base Annual Salary X Tier Target % X Award Allocation % | = | Target # of Shares Underlying Award | ||||||
| Intrinsic Value of Stock Option on Date of Grant | ||||||||
For PSUs:
| Base Annual Salary X Tier Target % X Award Allocation % | = | Target # of Shares Underlying Award | ||||||
| Grant Date Fair Value | ||||||||
Similarly, the Committee sets amounts for RSUs as a percentage of the named executive officer’s salary. In 2017,2020, the Committee increasedused 25% of base annual salary in its calculation of the number of RSUs granted, increasing the percentageshares underlying grants of base salary used to determine the grant date value of awards to 25 percent of base annual salary. This change produces awards of a greater number of RSUs than in prior years, as intended by the Committee to add greater weight to long-term equity compensation.RSU awards.
The following formula is used to calculate the number of shares underlying each grant of RSUs:
| Base Annual Salary X 25% | = | # of Shares Underlying Award | ||||||
| Grant Date Fair Value | ||||||||
Page 45
At its meeting on February 9, 2018,21, 2020, the Committee granted the following stock-based awards to the named executive officers:
| Name | # Nonqualified Stock Options | # PSUs | # RSUs | ||||||||
| Steven J. Johnston | 58,031 | 8,091 | 2,452 | ||||||||
| Michael J. Sewell | 28,551 | 3,981 | 2,042 | ||||||||
| Martin F. Hollenbeck | 23,833 | 3,323 | 1,705 | ||||||||
| Martin J. Mullen | 20,792 | 2,899 | 1,487 | ||||||||
| John S. Kellington | 19,522 | 2,722 | 1,396 | ||||||||
| Stephen M. Spray | 22,795 | 3,179 | 1,630 | ||||||||
| Name | # Nonqualified Stock Options | # PSUs | # RSUs |
| Steven J. Johnston | 84,765 | 11,937 | 3,618 |
| Jacob F. Scherer, Jr. | 46,365 | 6,529 | 3,349 |
| Michael J. Sewell | 41,700 | 5,873 | 3,012 |
| Martin F. Hollenbeck | 34,810 | 4,902 | 2,514 |
| Martin J. Mullen | 30,367 | 4,277 | 2,193 |
For the PSUs granted in 2018,2020, performance hurdles for threshold, target and maximum awards were set at the 30th, 50th and 75th percentiles, respectively, of the peer group. Stated another way, the company’s three-year total shareholder return must exceed that of three of the nine peer companies to achieve the threshold hurdle, must equal or exceed that of five peer companies to achieve the target hurdle and must equal or exceed that of seven peer companies to achieve the maximum hurdle. For PSUs granted in 2018,2020, achievement of threshold, target and maximum performance hurdles earns award payouts of 30 percent, 100 percent30%, 100% and 200 percent,200%, respectively, of target. If the company's three-year total shareholder return does not exceed that of at least three of the peer companies, no shares from the award are earned or paid.
The following formula describes how the Committee calculates the number of shares earned:
Target # of Shares Underlying Award X Performance Factor (0 - 200%)
The performance period for the PSUs awarded in 20182020 is the three calendar years ending December 31, 2020.2022. The PSUs will vest and become payable on March 1, 2021,2023, if the company achieves one of the performance hurdles described in the preceding paragraph.
Page 46
Compensation Realized From PSUs Granted in Prior Years
The company’s three-year TSR for the three-year performance period ended December 31, 2018,2020, was 43.0 percent,26.5%, exceeding that metric for foureight of the nine companies in the peer group and earning payout at the thresholdmaximum level of 30 percent200% of the target number of shares.
| Name | Performance Period | Target PSUs (#) | Achievement Level | PSUs Vested (#) | Value of PSUs Vested ($) (1) | ||||||||||||
| Steven J. Johnston | 2018-2020 | 11,937 | Maximum | 23,874 | 2,085,871 | ||||||||||||
| 2017-2019 | 11,670 | Target | 11,670 | 1,227,101 | |||||||||||||
| 2016-2018 | 11,768 | Threshold | 3,531 | 273,370 | |||||||||||||
| Michael J. Sewell | 2018-2020 | 5,873 | Maximum | 11,746 | 1,026,248 | ||||||||||||
| 2017-2019 | 5,632 | Target | 5,632 | 592,205 | |||||||||||||
| 2016-2018 | 6,247 | Threshold | 1,875 | 145,163 | |||||||||||||
| Martin F. Hollenbeck | 2018-2020 | 4,902 | Maximum | 9,804 | 856,576 | ||||||||||||
| 2017-2019 | 4,701 | Target | 4,701 | 494,310 | |||||||||||||
| 2016-2018 | 5,150 | Threshold | 1,545 | 119,614 | |||||||||||||
| Martin J. Mullen | 2018-2020 | 4,277 | Maximum | 8,554 | 747,363 | ||||||||||||
| 2017-2019 | 3,969 | Target | 3,969 | 417,340 | |||||||||||||
| 2016-2018 | 4,207 | Threshold | 1,263 | 97,781 | |||||||||||||
| John S. Kellington | 2018-2020 | 3,965 | Maximum | 7,930 | 692,844 | ||||||||||||
| 2017-2019 | 3,803 | Target | 3,803 | 399,885 | |||||||||||||
| 2016-2018 | 4,205 | Threshold | 1,262 | 97,704 | |||||||||||||
| Stephen M. Spray | 2018-2020 | 2,752 | Maximum | 5,504 | 480,885 | ||||||||||||
| 2017-2019 | 2,614 | Target | 2,614 | 274,862 | |||||||||||||
| 2016-2018 | 2,614 | Threshold | 785 | 60,775 | |||||||||||||
| Name | Performance Period | Target PSUs (#) | Achievement Level | PSUs Vested (#) | Value of PSUs Vested ($) (1) | ||||
| Steven J. Johnston | 2016-2018 | 11,768 | Threshold | 3,531 | 273,370 | ||||
| 2015-2017 | 13,573 | Target | 13,573 | 1,017,568 | |||||
| 2014-2016 | 12,873 | Target | 12,873 | 975,130 | |||||
| Jacob F. Scherer, Jr. | 2016-2018 | 7,081 | Threshold | 2,125 | 164,518 | ||||
| 2015-2017 | 8,087 | Target | 8,087 | 606,282 | |||||
| 2014-2016 | 8,850 | Target | 8,850 | 670,388 | |||||
| Michael J. Sewell | 2016-2018 | 6,247 | Threshold | 1,875 | 145,163 | ||||
| 2015-2017 | 7,205 | Target | 7,205 | 540,159 | |||||
| 2014-2016 | 7,885 | Target | 7,885 | 597,289 | |||||
| Martin F. Hollenbeck | 2016-2018 | 5,150 | Threshold | 1,545 | 119,614 | ||||
| 2015-2017 | 5,939 | Target | 5,939 | 445,247 | |||||
| 2014-2016 | 6,468 | Target | 6,468 | 489,951 | |||||
| Martin J. Mullen | 2016-2018 | 4,207 | Threshold | 1,263 | 97,781 | ||||
| 2015-2017 | 4,782 | Target | 4,782 | 358,507 | |||||
| 2014-2016 | 5,208 | Target | 5,208 | 394,506 | |||||
(1) Based on the closing price on Nasdaq as of the last trading day of the performance period as follows:
$87.37 for the performance period ending December 31, 2020
$105.08 for the performance period ending December 31, 2019
$77.42 for the performance period ending December 31, 2018
Other Stock-Based Compensation
The named executive officers are eligible to receive stock bonuses under the company’s broad-based Holiday Stock Plan, which annually awards one share of common stock to each full‑time associate in good standing for each year of service, up to a maximum of 10 shares. This plan, in effect since 1976, encourages stock ownership at all levels of the company.
Policy on Hedging and Pledging of Company Stock
Hedging - All of our officers and directors and certain associates identified by management as having regular access to potentially material, nonpublic information are prohibited from engaging in any form of hedging or monetization transactions involving the company’s stock. Such transactions can decouple the officer’s or director’s interest from the interests of shareholders generally and can limit the officer’s or director’s ability to control the timing of stock transactions to avoid times when in possession of material nonpublic information.
Pledging - We enjoy a strong culture of ownership, linking the long-term financial prospects for our associates to the long-term financial prospects for our shareholders generally through broad-based grants of equity compensation awards. Some of our associates, including some executive officers, choose to build their ownership in the company by pledging shares they own to collateralize loans from banks or brokers to exercise employee stock options. Some directors, officers and associates choose to
Page 47
hold their shares of stock in street name in accounts with banks or brokers as a matter of convenience. Depending on individual circumstances and decisions, these accounts can be subject to margin or collateral requirements.
Accordingly, we permit our directors, officers and associates to pledge shares of company stock that they own. The board expects directors and executive officers to exercise good judgment when making decisions about their holdings and transactions involving company stock, including pledging. The board anticipates that the level of share pledging by directors and executive officers will generally decrease over time. In 2018,At year end 2020, the numberpercentage of shares pledged by our directors and executive officers as a group increased by 0.1% to approximately 27,000 shares from 2017 levels as shares earned as stock compensation by certain executive officers were added to existing bank or broker accounts in which0.6% of the total number of shares previously owned significantly exceeded any loan amounts.outstanding. The 2020 increase is primarily due to a lower level of outstanding shares as of the December 31, 2020 measurement date.
A majority, 1718 of our current 27 directors and executive officers, do not pledge any shares. Another group of nineseven have pledged shares totaling less than 0.2 percent0.06% of the shares outstanding. One directorTwo directors with pledged shares is a memberare members of one of the company’s founding families, with reported holdings of company stock that sufficiently outnumber the approximately 0.4 percent0.54% of shares outstanding that he holdsthey hold in accounts and are available as collateral.
Stock-Based Award Grant Practices
In awarding stock options and other forms of stock-based compensation, the Committee follows certain general precepts:
Timing - Since 2010, the Committee established its February meeting as the date for granting stock-based compensation to company associates each year. This meeting is purposely scheduled to occur shortly after the company announces its financial results for the preceding quarter and year, and therefore occurs when it does not expect to be in possession of material nonpublic information. The Committee makes its grants of restricted stock to directors under the Directors’ Stock Plan of 2018 at its first regularly scheduled meeting of the year. The Committee believes the consistency of these practices eliminates concerns over timing. When grants are made at any other time of the year, the Committee ensures that such grants are made outside of any regular trading blackout associated with the company’s disclosure of financial results and when the company is not otherwise in possession of material nonpublic information.
Option Exercise Price - All stock-based compensation is granted at fair market value on the date of grant. Under all stock-based compensation plans, fair market value is defined as the average of the high and low sale price on Nasdaq on the grant date. Unless a future date is specified, the grant date is the date of the Committee meeting at which the grant is made. The Committee does not delegate timing or pricing of these stock-based awards to management.
Retirement Benefits
Defined Benefit Plans
In 2018,2020, Messrs. SchererMullen and MullenSpray were participants in The Cincinnati Financial Corporation Retirement Plan (Retirement Plan), our tax-qualified defined benefit pension plan. There are no special or enhanced pension formulas for the named executive officers, compared with other plan participants. The Retirement Plan was frozen and closed to new participants in mid-2008. Participants remaining in the Retirement Plan continue to accrue a benefit as prescribed by the plan's terms.
These two named executive officers also participate in The Cincinnati Financial Corporation Supplemental Retirement Plan (SERP). The SERP is unfunded and subject to forfeiture in the event of bankruptcy.
Page 48
The SERP is a nontax-qualifiednonqualified defined benefit plan maintained by the company to pay eligible associates the difference between the amount payable under the tax-qualified plan and the amount they
would have received without the tax-qualified plan’s limit due to Section 401(a)(17) and Section 415 of the Internal Revenue Code. Accordingly, the SERP definitions for service, normal retirement and annual earnings are the same as those for the Retirement Plan except the SERP’s definition of annual earnings is not limited.
For information about accumulated benefits under these plans and detailed information about the plans, see the 20182020 Pension Benefits table and the discussion following, beginning on Page 63.
Defined Contribution Plans
The named executive officers can participate in a tax-qualified 401(k) savings plan as well as the Cincinnati Financial Corporation Top Hat Savings Plan, a nonqualified deferred compensation plan for a select group of management or certain highly compensated associates. The company matches contributions to the 401(k) plan made by associates who are not members of the Retirement Plan, including Messrs. Johnston, Sewell, Hollenbeck and Hollenbeck,Kellington, up to a maximum of 6 percent6% of the associate’s annual cash compensation (salary and annual incentive compensation). The company also matches contributions by Messrs. Johnston, Sewell, Hollenbeck and HollenbeckKellington to the Top Hat Savings Plan of up to 6 percent6% of their annual cash compensation that exceeds the maximum recognizable compensation under Section 401(a)(17) of the Internal Revenue Code, which for 20182020 was $275,000.$285,000.
For information about the amount of company matching contributions and specific information about the defined contribution plans, see the 20182020 Nonqualified Deferred Compensation table and the discussion following, beginning on Page 65.
In 2008, the company transitioned away from providing associates with a defined benefit pension plan, instead choosing to assist associates with building savings for retirement by providing a company match of associate contributions to a tax-qualified 401(k) plan. This change was primarily in response to requests from associates who wanted control over their retirement benefit accounts. Participation in the defined benefit pension plan terminated for associates under the age of 40, and they transitioned to the new tax-qualified 401(k) plan with a company matching contribution. None of the named executive officers were under age 40 at the time of the transition. Associates age 40 and over as of August 31, 2008, were given a one-time election to remain in the defined benefit pension plan or to leave the plan and participate in the 401(k) plan with a company match. Those associates leaving the pension plan received distributions of their accumulated pension benefit from the defined benefit plan that they could choose to receive in cash, roll over to the company’s 401(k) plan or roll over to an Individual Retirement Account. Mr. Hollenbeck elected to leave the defined benefit plan in connection with the 2008 transition. Messrs. Johnston, Kellington and Sewell, hired after entry to the pension plan was closed, also participate in the 401(k) plan with the company match. Messrs. SchererMullen and MullenSpray elected to remain in the pension plan.
Perquisites and Other Personal Benefits
Perquisites and other personal benefits are intended to support our corporate objectives or the performance of an individual’s responsibilities. Perquisites and personal benefits are offered to the named executive officers on the same basis as to other company officers and may include employer-paid health insurance premiums, personal umbrella liability insurance coverage, life insurance, executive tax services, use of a company car, safe driver award, executive health exams, club dues and limited spouse travel and meals associated with certain business functions. The Committee believes that the level of perquisites and personal benefits we offer our officers is de minimis, totaling no more than $34,564$30,927 for any named executive officer in 2018.2020.
Page 49
CEO Pay Ratio
We are committed to transparency about our compensation practices. We provide detailed and comprehensive public disclosure about how the Committee structures our executive compensation program and makes individual compensation decisions for the chief executive officer and the other named executive officers each year. Internally, we provide transparency by publishing detailed information about salary bands for all positions. For annual cash incentive bonuses, we internally publish the bonus targets expressed as percentages of base annual compensation and provide a “bonus estimator” for associates to use to model how their annual incentive bonuses are affected by the company’s performance. Transparency was further enhanced in 2012, when we aligned all associate bonuses (from entry-level positions to our senior executives) to the same performance criteria. Since 2017, we also provide every associate with a “Current Compensation” summary that provides a total annual compensation value that is the sum of that associate’s base annual pay, the amount of the last annual incentive bonus paid and the value of the last paid restricted stock unit award. We also provide a full historical summary of all stock-compensationstock compensation awards. We expect that the CEO Pay Ratio disclosure will further enhance our transparency about compensation.
Our CEO to median employee pay ratio is calculated in accordance with Item 402(u) of Regulation S-K. We employ approximately 5,300 associates in the United States (U.S.) and 60 associates in the United Kingdom (U.K.). As permitted by the de minimis exemption of the rule, all of our associates employed in the U.K. are excluded from the pay ratio calculation because there were no significant changes tothey account for less than 5% of the total number of our compensation programs or employee base in 2018, we used the same median employee for the 2018 ratio as we used for 2017.U.S. and non-U.S. associates. In 2017,2020, we identified the median employee by examining the annual total compensation for all of our U.S. associates, excluding our CEO, who were employed by us on December 1, 2017.2020. We included all U.S. associates, whether employed on a full-time, part-time or seasonal basis. To determine the median employee, we calculated the total annual compensation for each of our then 5,0725,354 associates as the sum of the following amounts:
•Annual base pay
•Increase in the value of the associate’s pension benefit
•The company’s contribution to the associate’s health insurance coverage
•The company’s matching contributions to the associate’s 401(k) account
•The company’s matching contributions to the associate's nonqualified deferred compensation (top hat)(Top Hat) account
•Calendar year cash bonus
•Calendar year stock compensation grants (time and or performance vesting restricted stock units)
•Calendar year stock option grants (incentive or nonqualified stock options)
•Holiday stock compensation
We believe the use of these components for all associates is a consistently applied compensation measure that includes all of the compensation elements that are widely distributed throughout our organization, including retirement benefits.
After identifying the median employee based on the process described above, we calculated annual total compensation for the median employee using the same methodology we use for our named executive officers as set forth in the 20182020 Summary Compensation Table later in this proxy statement. The total annual compensation calculated for our CEO was $3,444,610$3,839,784 and for our median employee was $88,046.$100,751. The resulting ratio for our CEO’s pay compared with the pay of our median employee for 20182020 is 39.138.1 to 1.
Page 50
How We Make Compensation Decisions
Annual Compensation Setting Process
The Committee evaluates and sets compensation for the named executive officers annually. In doing so, it considers:
•Its judgment about the effectiveness of the executive compensation program generally;
•The effect of any changes to the program;
•The result of the most recent shareholder advisory vote to approve executive compensation and feedback about the executive compensation program received from shareholders during annual outreach calls;
•The compensation risk assessment conducted by the company’s chief risk officer;
•Current and historical compensation and performance data supplied by the chief executive officer for each named executive officer, excluding himself;
•Reports generated through Equilar on the amounts and components of compensation paid to the named executive officers of the companies in the peer group;
•Reports generated through Equilar on the financial performance of the companies in the peer group;
•Each officer’s individual performance, experience, expertise and functional responsibilities; and
•Company performance, both financial and nonfinancial.
The Committee meets in February each year to set base annual salaries, grant stock-based and incentive cash compensation awards and consider the payment of any performance-based compensation earned upon satisfaction of performance goals established in prior years’ award grants. The Committee also may meet during the year to set or adjust compensation appropriately if management changes or new executive officers join the company or to consider potential prospective changes to the structure of the executive compensation program.
Compensation Risk Considerations
The Committee is responsible for overseeing the risk associated with the company’s compensation program. The company’s compensation plans and executive compensation program are designed with features intended to mitigate risk without diminishing the incentive nature of the compensation. We believe our compensation plans and programs encourage and reward prudent business judgment and appropriate risk taking, and do not create risks that are reasonably likely to have a material adverse impact on the company.
In 2018,2020, the Committee considered the annual compensation risk assessment conducted by the chief risk officer. For the executive compensation program, the risk assessment identified the component parts of the program and the information and process used by the Committee to set the level of compensation for each. Independence and qualifications of committee members and rigor of the committee’s oversight and administration of the executive compensation program also were examined.
Page 51
The table below summarizes the risk mitigation factors identified in the annual compensation risk assessment.
Base Annual Salary Risk Mitigation Factors Base annual salary is set each year. Base annual salary adjustments require approval of the Committee. | ||
Annual Incentive Risk Mitigation Factors Awards are based upon multi-metric performance objectives. The primary performance objective is relative to peer companies. The two other performance objectives are publicly reported in the company's periodic reports. Achievement is determined by company performance, not individual performance. Robust processes require the Committee to certify performance achievement and authorize payment. Maximum payout of annual incentive compensation is capped. The Committee may exercise negative discretion to reduce or eliminate awards when appropriate. Annual incentive compensation is subject to clawback provisions. Performance objectives and targets are easily calculable and clearly disclosed to investors. | ||
Long-Term Stock-Based Compensation Risk Mitigation Factors The company has stock ownership guidelines applicable to the named executive officers. Exercising stock options requires investment of the associate’s personal assets. Performance objectives are relative to peer companies. Achievement of performance for PSUs is determined by company performance, not individual performance. Robust processes require the Committee to certify performance achievement and authorize payment. Maximum payout of performance-based restricted stock units is capped. Stock-based compensation is subject to clawback provisions. Performance objectives and targets are easily calculable and clearly disclosed to investors. | ||
Benchmarking and Peer Group
We believe that increasing compensation for our named executive officers to achieve a benchmark at or above the median of our peers would serve only to increase compensation expense without a corresponding benefit to shareholders. Our approach is to consider competitive compensation practices and relevant factors about executive compensation program structures and award types used by the companies in our Peer Grouppeer group to maintain an awareness of pay levels and practices, which as one of many factors considered each year by the Committee may influence appropriate changes to our executive compensation structure and levels over time. This approach provides us with flexibility in maintaining and enhancing our executive officers’ focus, motivation and enthusiasm for our future while controlling overall compensation expense. We believe our levels of compensation are competitively reasonable and appropriate for our business needs and circumstances.
We do use the peer group to compare our performance to those companies against whom we compete each day, irrespective of the size of any peer company. We believe that it is important to link performance-based compensation to company performance compared with peers. Accordingly, the primary performance targets for our annual incentive compensation and PSUs are relative targets compared with our peer group. We also believe that linking the level of performance-based awards to a percentage of base annual salary that is paid out according to a predetermined formula based upon achievement of performance goals for all of our executive officers unites the personal financial interests of the executive team, focusing its attention on achievement of performance goals designed to increase shareholder value over the long term.
Page 52
The Committee reviews performance and compensation data of the peer group to gain a sense of whether we are providing generally competitive compensation for our named executive officers individually and as a group. For 2018,2020, the nine peer companies are:
were:
The Allstate Corporation Hanover Insurance Group Inc. Hartford Financial Services Group Inc. Markel Corporation Selective Insurance Group Inc. | State Auto Financial Corporation The Travelers Companies Inc. United Fire Group Inc. W.R. Berkley Corporation | ||||
These nine U.S.-domiciled companies were selected because they generally market their products through the same types of independent insurance agencies that represent our company, and they provide both commercial lines and personal lines of insurance, as we do. We also included companies in the peer group that historically have followed an equity investment strategy similar to ours, or that offer life insurance products or excess and surplus lines coverages.
Comparative performance and compensation data reviewed by the Committee suggests that the company’s executive compensation is not excessive as compared with performance and compensation levels of the peer group. As reported by Equilar, Total Direct Compensation of $14,711,912$12,565,552 awarded to our named executive officers as a group in 2017,2019, the last year for which peer data is available, was approximately 69 percent58% of the average Total Direct Compensation of $21,374,260$21,833,496 awarded by companies in the peer group to their named executive officers as a group in the same year. The following table ranks the company and the nine companies in the peer group according to market capitalization at December 31, 2018,2020, and ranks three-year value creation ratio, three-year total shareholder returns as of December 31, 2018,2020, as reported by Bloomberg LP, and compensation data compiled by Equilar from the 20182020 proxy statements filed by the peer group, the most recent year for which such data is available.
| Rank | Market Capitalization | Three-Year Value Creation Ratio | Three-Year Total Shareholder Return | Total Direct Compensation (from | |||||||||||
| 1 | Travelers | ||||||||||||||
| 2 | Allstate | Travelers | |||||||||||||
| 3 | Hartford | ||||||||||||||
| 4 | Markel | Hanover | Hartford | ||||||||||||
| 5 | Cincinnati | ||||||||||||||
| 6 | W.R. Berkley | Travelers | |||||||||||||
| 7 | Hanover | ||||||||||||||
| 8 | Selective | Markel | Markel | Hanover | |||||||||||
| 9 | State Auto | State Auto | |||||||||||||
| 10 | United Fire | ||||||||||||||
Page 53
Compensation Consultants
The Committee does not employ compensation consultants for recommendations concerning executive compensation. Our compensation programs are not complex and, because we do not benchmark compensation to peers, the Committee does not believe it requires the services of a compensation consultant to assist with either administration of current plans or the determination of appropriate levels of compensation. The Committee will continue to monitor our compensation structure to ensure that the compensation it wishes to deliver to the executive team is delivered as appropriate, considering overall company and individual performance. The Committee does review and consider peer group performance and compensation data collected from the Equilar service and publicly available proxy statements and Form 10-K filings.
Tax Considerations
Section 162(m) limits to $1 million per year the federal income tax deduction to public corporations for compensation paid in any fiscal year to any individual who is identified as a named executive officer as of the end of the fiscal year in accordance with the Exchange Act. Until the enactment of the Jobs and Tax Reform Act of 2017 (Tax Reform) this limitation did not apply to qualifying “performance-based compensation.” The Committee intended that PSUs (which permit the Committee to exercise negative discretion to reduce or eliminate payment of awards) and stock options that are subject to binding agreements in effect before November 2, 2017, to qualify for the performance-based compensation exception to the $1 million limitation under prior law.
Beginning with grants of performance-based compensation made after November 2, 2017, Tax Reform removes the tax deduction for compensation of our named executive officers in excess of $1 million, even if that compensation results from what previously would have qualified as "performance-based compensation" under 162(m). We believe that performance-based compensation remains an effective incentive to drive short-term and long-term results that benefit our company and its shareholders, and we will continue to use it. We also expect that the overall beneficial effect of Tax Reform on our country's economy, in general and the domestic insurance industry, in particular, and the positive impact that we expect those beneficial effects to have on our company in the future more than outweigh the loss of a tax deduction for executive compensation.
The Committee generally does not favor the payment of tax gross-ups. Except in limited circumstances, such as a retirement gift of nominal value or relocation assistance on the same basis offered to all retiring or relocating associates, the Committee has not authorized payment of tax gross-ups to executive officers.
Page 54
Employment Agreements, Change in Control Provisions and
Post-Retirement Benefits
We do not have employment agreements with any of our named executive officers that specify a term of employment or guarantee minimum levels of bonuses or stock-based awards. All of our named executive officers are at-will employees. Our long-standing corporate perspective has been that employment contracts do not provide the company with any significant advantage. We believe our corporate culture, current compensation practices and levels of stock ownership by our executive officers have resulted in stability in our current 14-member13-member group of executive officers, who average 2425 years with the company.
In 2011, in connection with hiring Mr. Sewell as our chief financial officer, the Committee authorized a deferred compensation agreement between the company and Mr. Sewell designed to approximate the value of retirement benefits that he would forego at his former employer. Mr. Sewell is fully vested in amounts payable under the agreement. No amounts areAmounts become payable under the agreement until Mr. Sewell reaches theat age of 58.
Change in control provisions are included in our 2016 and 2012 Stock Compensation Plans and our 2009 Annual Incentive Plan, and those provisions apply to all associates receiving awards under the plans, not just to executive officers. The change in control provisions in these plans contain a “double trigger,” which requires both a change in control event, as defined in the plans, and termination of the associate’s employment due to the change in control within a specified time period. The double trigger ensures that we will become obligated to accelerate vesting of prior awards only if the associate is actually or constructively discharged because of the change in control event.
We occasionally provide post-retirement benefits to long-tenured executive-officer-level associates who provide services to the company after retirement from their executive positions. These post-retirement benefits are intended to compensate the associate for ongoing services associated with maintaining continuity of relationships and providing guidance to their successors and other associates. No post-retirement benefits were paid to any former executive officer in 2018.2020.
2020 Summary Compensation Table
| Name and Principal Position | Year | Salary ($) | Bonus ($) (1) | Stock Awards ($) (2) (4) | Option Awards ($) (3) | Nonequity Incentive Plan Compen- sation ($) | Change in Pension Value and Nonqualified Deferred Compen-sation Earnings ($) (5) | All Other Compen-sation ($) (8)(9) | Total Compen-sation ($) | ||||||||||||||||||||||||||
| Steven J. Johnston Chairman, President and Chief Executive Officer Cincinnati Financial Corporation | 2020 | 1,129,740 | — | 1,167,096 | 902,382 | 410,175 | — | 230,391 | 3,839,784 | ||||||||||||||||||||||||||
| 2019 | 1,055,790 | — | 1,152,831 | 876,100 | 2,336,246 | — | 107,687 | — | 5,528,654 | ||||||||||||||||||||||||||
| 2018 | 1,025,385 | — | 999,111 | 849,752 | 339,900 | — | 230,462 | — | 3,444,610 | ||||||||||||||||||||||||||
| Michael J. Sewell Chief Financial Officer, Senior Vice President and Treasurer Cincinnati Financial Corporation | 2020 | 940,608 | — | 663,834 | 443,968�� | 204,907 | — | 158,331 | 2,411,648 | ||||||||||||||||||||||||||
| 2019 | 878,971 | — | 677,057 | 431,001 | 1,149,308 | — | 95,915 | 3,232,252 | |||||||||||||||||||||||||||
| 2018 | 851,218 | — | 574,408 | 418,034 | 167,213 | — | 150,667 | 2,161,540 | |||||||||||||||||||||||||||
| Martin F. Hollenbeck Chief Investment Officer and Senior Vice President Cincinnati Financial Corporation | 2020 | 785,168 | — | 554,352 | 370,603 | 171,045 | — | 129,739 | 2,010,907 | ||||||||||||||||||||||||||
| 2019 | 733,727 | — | 545,770 | 359,774 | 959,392 | — | 80,981 | 2,679,644 | |||||||||||||||||||||||||||
| 2018 | 710,560 | — | 479,777 | 348,963 | 139,582 | — | 120,935 | 1,799,817 | |||||||||||||||||||||||||||
| Martin J. Mullen (Retired)* Chief Claims Officer and Senior Vice President The Cincinnati Insurance Company | 2020 | 688,485 | — | 483,666 | 323,316 | 149,220 | 382,417 | (6) | 20,883 | 2,047,987 | |||||||||||||||||||||||||
| 2019 | 640,080 | — | 476,249 | 313,864 | 836,943 | 978,232 | (6) | 20,083 | 3,265,451 | ||||||||||||||||||||||||||
| 2018 | 616,919 | — | 418,678 | 304,423 | 121,767 | 104,226 | (6) | 22,883 | 1,588,896 | ||||||||||||||||||||||||||
| John S. Kellington Chief Information Officer and Senior Vice President The Cincinnati Insurance Company | 2020 | 642,029 | — | 454,159 | 303,567 | 140,107 | — | 106,865 | 1,646,727 | ||||||||||||||||||||||||||
| Stephen M. Spray Chief Insurance Officer and Senior Vice President The Cincinnati Insurance Company | 2020 | 735,773 | — | 530,243 | 354,462 | 163,597 | 530,698 | (7) | 31,173 | 2,345,946 | |||||||||||||||||||||||||
| 2019 | 606,692 | — | 463,731 | 305,561 | 814,815 | 256,168 | (7) | 32,919 | 2,479,885 | ||||||||||||||||||||||||||
| Name and Principal Position | Year | Salary ($) | Bonus ($) (1) | Stock Awards ($) (2)(4) | Option Awards ($) (3) | Non- equity Incentive Plan Compen- sation ($) | Change in Pension Value and Nonqualified Deferred Compen- sation Earnings ($) (5) | All Other Compen- sation ($) (8)(9) | Total Compen- sation ($) | ||
Steven J. Johnston Chief Executive Officer and President Cincinnati Financial Corporation | 2018 | 1,025,385 | — | 999,111 | 849,752 | 339,900 | — | 230,462 | 3,444,610 | ||
| 2017 | 995,351 | — | 741,917 | 825,010 | 2,200,000 | — | 216,678 | — | 4,978,956 | ||
| 2016 | 960,814 | — | 917,696 | 155,459 | 2,121,792 | — | 94,142 | — | 4,249,903 | ||
Jacob F. Scherer, Jr. Chief Insurance Officer and Executive Vice President The Cincinnati Insurance Company | 2018 | 949,152 | — | 638,786 | 464,800 | 185,918 | 621,358 | (6) | 26,991 | 2,887,005 | |
| 2017 | 921,351 | — | 495,696 | 451,262 | 1,203,350 | 506,246 | (6) | 35,832 | 3,613,737 | ||
| 2016 | 887,747 | — | 581,968 | 93,542 | 1,160,572 | 575,137 | (6) | 19,200 | 3,318,166 | ||
Michael J. Sewell Chief Financial Officer, Senior Vice President and Treasurer Cincinnati Financial Corporation | 2018 | 851,218 | — | 574,408 | 418,034 | 167,213 | — | 150,667 | 2,161,540 | ||
| 2017 | 812,871 | — | 437,114 | 398,126 | 1,061,667 | — | 140,114 | 2,849,892 | |||
| 2016 | 784,665 | — | 513,159 | 82,525 | 1,023,925 | — | 71,520 | 2,475,794 | |||
Martin F. Hollenbeck Chief Investment Officer and Senior Vice President Cincinnati Financial Corporation | 2018 | 710,560 | — | 479,777 | 348,963 | 139,582 | — | 120,935 | 1,799,817 | ||
| 2017 | 677,473 | — | 365,250 | 332,338 | 886,234 | — | 110,600 | 2,371,895 | |||
| 2016 | 646,808 | — | 423,473 | 68,033 | 844,032 | — | 59,884 | 2,042,230 | |||
Martin J. Mullen Chief Claims Officer and Senior Vice President The Cincinnati Insurance Company | 2018 | 616,919 | — | 418,678 | 304,423 | 121,767 | 104,226 | (7) | 22,883 | 1,588,896 | |
| 2017 | 569,629 | — | 308,518 | 280,573 | 748,182 | 590,191 | 21,788 | 2,518,881 | |||
(1) Since 2010, the Committee has eliminated discretionary cash bonuses as a regular component of compensation for the named executive officers.
(2) Amounts shown in the Stock Awards column reflect values for grants of PSUs, RSUs and Holiday Stock awards. Amounts for PSUs reflect the full grant date fair values in accordance with FASB ASC 718 and are computed using a Monte Carlo valuation on the date of grant. Amounts for RSUs reflect the full grant date fair value in accordance with FASB ASC 718. These amounts do not represent the actual value, if any, that may be realized in the future by the named executive officers. For assumptions used in determining the values for awards of PSUs and RSUs, see our 2020 Annual Report on Form 10-K, Part II, Item 8, Note 17, Page 176. Awards under the Holiday Stock Plan are valued at fair market value on the date of grant. The per share fair market values were $74.40, $108.95 and $81.46 for the grant dates of November 6, 2020, November 8, 2019 and November 9, 2018, respectively.
(3) Amounts in the Option Awards column reflect the value of awards for grants of nonqualified stock options and reflect the full grant date fair values in accordance with FASB ASC 718. These amounts do not represent the actual value, if any, that may be realized in the future by the named executive officers. For assumptions used in calculation of option awards, see our 2020 Annual Report on Form 10-K, Part II, Item 8, Note 17, Page 176.
(4) Maximum values of PSUs granted in 2017 are: $1,009,6882020 are $1,808,662 for Mr. Johnston; $552,257 for Mr. Scherer; $487,281$889.913 for Mr. Sewell; $406,731$742,823 for Mr. Hollenbeck; and $343,398$648,042 for Mr. Mullen.Mullen; $608,476 for Mr. Kellington and $710,634 for Mr. Spray.
Maximum values of PSUs granted in 20162019 are: $1,652,933$1,799,338 for Mr. Johnston; $994,597 for Mr. Scherer; $877,453$885,154 for Mr. Sewell; and $723,369$738,948 for Mr. Hollenbeck.Hollenbeck; $644,644 for Mr. Mullen and $627,578 for Mr. Spray.
Maximum values for PSUs granted in 2018 are: $1,510,985 for Mr. Johnston; $743,404 for Mr. Sewell; $620,495 for Mr. Hollenbeck; and $541,383 for Mr. Mullen. (5) No above-market or preferential earnings were paid on deferred compensation. The amounts shown in this column represent the aggregate change in actuarial present value of accumulated pension benefits for those named executive officers participating in the company’s Retirement Plan and SERP for each of the years presented, using the same pension plan measurement date and assumptions used for financial reporting purposes. In addition to one year of service credit under the Retirement Plan and the |
SERP for Messrs. SchererMullen and Mullen,Spray, the changes in plan balances are primarily due to fluctuations in the applicable interest rate and discount rate used to actuarially calculate the accumulated benefit in each plan.
Page 56 (6) Mr. Mullen retired in 2020 and pursuant to the Plan, his Qualified Pension Plan benefit was paid on January 1, 2021. Distribution of Mr. Mullen's SERP benefit was delayed as a matter of law and in accordance with the plan for six months following his separation from service. In 2020 there was an increase of $123,051 in his Retirement Plan benefit and an increase of $259,366 in his SERP benefit. For the other years presented for Mr. Mullen, in 2019, an increase of $412,556 in the Retirement Plan and an increase of $565,676 in the SERP; and in 2018, a decrease of $10,073 in the Retirement Plan and an increase of $114,299 in the SERP. (7) For Mr. Spray, in 2020, an increase of $233,687 in the Retirement Plan and an increase of $297,011 in the SERP and in 2019, an increase of $120,475 in the Retirement Plan and an increase of $135,693 in the SERP. (8) For Mr. Johnston, includes perquisites in the amount of $20,107, which includes $16,429 for employer paid health care premiums; premiums paid for a personal umbrella liability policy; personal use of a company car; safe driver award; and an executive health examination. For Mr. Sewell, includes perquisites in the amount of $30,927, which includes $24,121 for employer paid health care premiums; executive tax services; premiums paid for a personal umbrella liability insurance policy; personal use of a company car; and a safe driver award. For Mr. Hollenbeck, includes perquisites in the amount of $23,399, which includes $16,429 for employer paid health care premiums; premiums paid for a personal umbrella liability insurance policy; personal use of a company car; executive tax services; a safe driver award; and an executive health examination. For Mr. Mullen, includes perquisites in the amount of $19,448, which includes $15,797 for employer paid health care premiums; |
For Mr. Sewell,Kellington, includes perquisites in the amount of $33,885,$19,639, which includes $21,881$16,429 for employer paid health care premiums; $3,729 for the incremental additional cost of spouse travel and meals for business events to which spouses are invited; $4,125 for executive tax services; premiums paid for a personal umbrella liability insurance policy; personal use of a company car; and a safe driver award.
For Mr. Hollenbeck,Spray, includes perquisites in the amount of $23,893,$29,726, which includes $14,903$24,121 for employer paid health care premiums; $5,949 for the incremental additional cost of spouse travel and meals for business events to which spouses are invited; premiums paid for a personal umbrella liability insurance policy; executive tax services; and personal use of a company car; executive tax services;car, and a safe driver award;award.
(9) Includes matching contributions to the company’s 401(k) and an executive health examination.
Total compensation for 20182020 shown in the 2018 Summary Compensation Table, excluding attributions of compensation related to retirement plans, generally decreased from 20172019 levels because of lower payouts of annual incentive compensation; at the threshold level of 30 percent30% of target for 2018,2020 compared with the maximum level of 200 percent200% of target for 2017.2019.
Total compensation for 20172019 shown in the Summary Compensation Table, excluding attributions of compensation related to retirement plans, generally increased from 20162018 levels because of higher payouts of annual incentive compensation at the increased numbermaximum level of nonqualified stock options and RSUs awarded in connection200% of target for 2019, compared with structural changes made to the executive compensation program to add greater weight to long-term, stock-based compensation.threshold level of 30% of target for 2018.
Amounts shown in the Salary column do not exactly match the base annual salaries set by the Committee for the year because of the timing of adjustments to base annual salary made in the respective years. Amounts shown in the Salary column for 2020 reflect one additional pay period compared with 2019. The history of changes to base annual salaries for the named executive officers for the reported years is set forth below:
In February 2020, the Committee adjusted base annual salaries to $1,093,800 for Mr. Johnston; to $910,700 for Mr. Sewell; to $760,200 for Mr. Hollenbeck; to $663,200 for Mr. Mullen; to $622,700 for Mr. Kellington; and to $727,100 for Mr. Spray.
In February 2019, the Committee adjusted base annual salaries to $1,061,930 for Mr. Johnston; to $884,083 for Mr. Sewell; to $737,994 for Mr. Hollenbeck; to $643,802 for Mr. Mullen; and to $626,781 for Mr. Spray.
In February 2018, the Committee adjusted base salaries to $1,030,000 for Mr. Johnston; to $953,424 for Mr. Scherer; to $857,500 for Mr. Sewell; to $715,804 for Mr. Hollenbeck; and to $624,445 for Mr. Mullen.
Amounts shown in the Change in Pension Value and Nonqualified Deferred Compensation Earnings column of the Summary Compensation Table represent the annual incremental changes in the present values of benefits under the company’s defined benefit and SERP plans. Changes in the balances of the Top Hat accounts of named executive officers due to their contributions, company matching contributions, if any, and investment performance during the year are included in the All Other Compensation column of the Summary Compensation Table. For information about these plans, see Retirement Benefits, Page 48.
Page 57
| Name | Grant Date | Estimated Possible Payouts Under Nonequity Incentive Plan Awards | Estimated Possible Payouts Under Equity Incentive Plan Awards | All Other Stock Awards: Number of Shares of Stock or Units (2) | All Other Option Awards: Number of Securities Under-lying Options | Exercise or Base Price of Option Awards | Grant Date Fair Value of Stock and Option Awards | |||||||||||||||||||||||||||||||
| Threshold ($) | Target ($) | Maximum ($) | Threshold (#) | Target (#) | Maximum (#) | (#) | (#) | ($/Sh) | ($) | |||||||||||||||||||||||||||||
| Mr. Johnston | 2/21/2020 | ** | 58,031 | 111.53 | 902,382 | |||||||||||||||||||||||||||||||||
| 2/21/2020 | * | 410,175 | 1,367,249 | 2,734,499 | ||||||||||||||||||||||||||||||||||
| 2/21/2020 | ** | 2,428 | 8,091 | 16,182 | 904,331 | |||||||||||||||||||||||||||||||||
| 2/21/2020 | ** | 2,452 | 262,021 | |||||||||||||||||||||||||||||||||||
| 11/6/2020 | *** | 10 | 744 | |||||||||||||||||||||||||||||||||||
| Mr. Sewell | 2/21/2020 | ** | 28,551 | 111.53 | 443,968 | |||||||||||||||||||||||||||||||||
| 2/21/2020 | * | 204,907 | 683,025 | 1,366,050 | ||||||||||||||||||||||||||||||||||
| 2/21/2020 | ** | 1,195 | 3,981 | 7,962 | 444,956 | |||||||||||||||||||||||||||||||||
| 2/21/2020 | ** | 2,042 | 218,208 | |||||||||||||||||||||||||||||||||||
| 11/6/2020 | *** | 9 | 670 | |||||||||||||||||||||||||||||||||||
| Mr. Hollenbeck | 2/21/2020 | ** | 23,833 | 111.53 | 370,603 | |||||||||||||||||||||||||||||||||
| 2/21/2020 | * | 171,045 | 570,150 | 1,140,300 | ||||||||||||||||||||||||||||||||||
| 2/21/2020 | ** | 997 | 3,323 | 6,646 | 371,412 | |||||||||||||||||||||||||||||||||
| 2/21/2020 | ** | 1,705 | 182,196 | |||||||||||||||||||||||||||||||||||
| 11/6/2020 | *** | 10 | 744 | |||||||||||||||||||||||||||||||||||
| Mr. Mullen | 2/21/2020 | ** | 20,792 | 111.53 | 323,316 | |||||||||||||||||||||||||||||||||
| 2/21/2020 | * | 149,220 | 497,400 | 994,800 | ||||||||||||||||||||||||||||||||||
| 2/21/2020 | ** | 870 | 2,899 | 5,798 | 324,021 | |||||||||||||||||||||||||||||||||
| 2/21/2020 | ** | 1,487 | 158,901 | |||||||||||||||||||||||||||||||||||
| 11/6/2020 | *** | 10 | 744 | |||||||||||||||||||||||||||||||||||
| Mr. Kellington | 2/21/2020 | ** | 19,522 | 111.53 | 303,567 | |||||||||||||||||||||||||||||||||
| 2/21/2020 | * | 140,107 | 467,025 | 934,049 | ||||||||||||||||||||||||||||||||||
| 2/21/2020 | ** | 817 | 2,722 | 5,444 | 304,238 | |||||||||||||||||||||||||||||||||
| 2/21/2020 | ** | 1,396 | 149,177 | |||||||||||||||||||||||||||||||||||
| 11/6/2020 | *** | 10 | 744 | |||||||||||||||||||||||||||||||||||
| Mr. Spray | 2/21/2020 | ** | 22,795 | 111.53 | 354,462 | |||||||||||||||||||||||||||||||||
| 2/21/2020 | * | 163,597 | 545,325 | 1,090,650 | ||||||||||||||||||||||||||||||||||
| 2/21/2020 | ** | 954 | 3,179 | 6,358 | 355,317 | |||||||||||||||||||||||||||||||||
| 2/21/2020 | ** | 1,630 | 174,182 | |||||||||||||||||||||||||||||||||||
| 11/6/2020 | *** | 10 | 744 | |||||||||||||||||||||||||||||||||||
* Cincinnati Financial Corporation 2009 Incentive Compensation Plan
** Cincinnati Financial Corporation 2016 Stock Compensation Plan
*** Holiday Stock Plan. See Long-Term Stock-Based Compensation, Page 43, for information about awards of shares under the Holiday Stock Plan.
(1) No material modifications or repricing occurred with respect to any outstanding option or other stock-based award in 2020.
(2) The grant date fair value of shares awarded under the Holiday Stock Plan is 100% of the average of the high and low sales price on Nasdaq on the date of grant, which was $74.40 on November 6, 2020.
Page 58
| Name | Grant Date | Estimated Possible Payouts Under Nonequity Incentive Plan Awards | Estimated Possible Payouts Under Equity Incentive Plan Awards | All Other Stock Awards: Number of Shares of Stock or Units (2) | All Other Option Awards: Number of Securities Under-lying Options | Exercise or Base Price of Option Awards | Grant Date Fair Value of Stock and Option Awards | |||||||||||||||
| Threshold ($) | Target ($) | Maximum ($) | Threshold (#) | Target (#) | Maximum (#) | (#) | (#) | ($/Sh) | ($) | |||||||||||||
| Mr. Johnston | 2/9/2018 | ** | 84,765 | 71.19 | 849,752 | |||||||||||||||||
| 2/9/2018 | * | 339,900 | 1,133,000 | 2,266,000 | ||||||||||||||||||
| 2/9/2018 | ** | 3,581 | 11,937 | 23,874 | 755,493 | |||||||||||||||||
| 2/9/2018 | ** | 3,618 | 242,804 | |||||||||||||||||||
| 11/9/2018 | *** | 10 | 815 | |||||||||||||||||||
| Mr. Scherer | 2/9/2018 | ** | 46,365 | 71.19 | 464,800 | |||||||||||||||||
| 2/9/2018 | * | 185,918 | 619,725 | 1,239,451 | ||||||||||||||||||
| 2/9/2018 | ** | 1,958 | 6,529 | 13,058 | 413,220 | |||||||||||||||||
| 2/9/2018 | ** | 3,349 | 224,751 | |||||||||||||||||||
| 11/9/2018 | *** | 10 | 815 | |||||||||||||||||||
| Mr. Sewell | 2/9/2018 | ** | 41,700 | 71.19 | 418,034 | |||||||||||||||||
| 2/9/2018 | * | 167,213 | 557,375 | 1,114,750 | ||||||||||||||||||
| 2/9/2018 | ** | 1,761 | 5,873 | 11,746 | 371,702 | |||||||||||||||||
| 2/9/2018 | ** | 3,012 | 202,135 | |||||||||||||||||||
| 11/9/2018 | *** | 7 | 570 | |||||||||||||||||||
| Mr. Hollenbeck | 2/9/2018 | ** | 34,810 | 71.19 | 348,963 | |||||||||||||||||
| 2/9/2018 | * | 139,582 | 465,273 | 930,545 | ||||||||||||||||||
| 2/9/2018 | ** | 1,470 | 4,902 | 9,804 | 310,248 | |||||||||||||||||
| 2/9/2018 | ** | 2,514 | 168,715 | |||||||||||||||||||
| 11/9/2018 | *** | 10 | 815 | |||||||||||||||||||
| Mr. Mullen | 2/9/2018 | ** | 30,367 | 71.19 | 304,423 | |||||||||||||||||
| 2/9/2018 | * | 121,767 | 405,889 | 811,778 | ||||||||||||||||||
| 2/9/2018 | ** | 1,283 | 4,277 | 8,554 | 270,691 | |||||||||||||||||
| 2/9/2018 | ** | 2,193 | 147,172 | |||||||||||||||||||
| 11/9/2018 | *** | 10 | 815 | |||||||||||||||||||
Outstanding Equity Awards at 20182020 Year End
| Option Awards (1) | Stock Awards | ||||||||||||||||||||||||||||||||||
| Name | Number of Securities Underlying Unexercised Options Exercisable (#) | Number of Securities Underlying Unexercised Options Unexercisable (#) | Equity Incentive Plan Awards: Number of Securities Underlying Unexercised Unearned Options (#) | Option Exercise Price ($) | Option Expiration Date | Number of Shares or Units of Stock That Have Not Vested (#) (2)(3)(4) | Market Value of Shares or Units of Stock That Have Not Vested ($) | Equity Incentive Plan Awards: Number of Unearned Shares, Units or Other Rights That Have Not Vested (#) (2)(3)(4) | Equity Incentive Plan Awards: Market or Payout Value of Unearned Shares, Units or Other Rights That Have Not Vested ($) | ||||||||||||||||||||||||||
| Mr. Johnston | 4,893 | — | 31.62 | 5/2/2021 | |||||||||||||||||||||||||||||||
| 13,472 | — | 35.63 | 2/17/2022 | ||||||||||||||||||||||||||||||||
| 13,088 | — | 44.70 | 2/15/2023 | ||||||||||||||||||||||||||||||||
| 12,873 | — | 46.81 | 2/14/2024 | ||||||||||||||||||||||||||||||||
| 13,573 | — | 52.25 | 2/13/2025 | ||||||||||||||||||||||||||||||||
| 11,768 | — | 61.47 | 2/12/2026 | ||||||||||||||||||||||||||||||||
| 76,484 | — | 70.70 | 12/10/2027 | ||||||||||||||||||||||||||||||||
| 56,510 | 28,255 | 71.19 | 2/9/2028 | ||||||||||||||||||||||||||||||||
| 11,937 | 1,042,936 | ||||||||||||||||||||||||||||||||||
| 1,206 | 105,368 | ||||||||||||||||||||||||||||||||||
| 24,235 | 48,471 | 85.67 | 2/21/2029 | ||||||||||||||||||||||||||||||||
| 10,227 | 893,533 | ||||||||||||||||||||||||||||||||||
| 2,066 | 180,506 | ||||||||||||||||||||||||||||||||||
| 58,031 | 111.53 | 2/21/2030 | |||||||||||||||||||||||||||||||||
| 8,091 | 706,911 | ||||||||||||||||||||||||||||||||||
| 2,452 | 214,231 | ||||||||||||||||||||||||||||||||||
| Mr. Sewell | 8,016 | — | 44.70 | 2/15/2023 | |||||||||||||||||||||||||||||||
| 7,885 | — | 46.81 | 2/14/2024 | ||||||||||||||||||||||||||||||||
| 7,205 | — | 52.25 | 2/13/2025 | ||||||||||||||||||||||||||||||||
| 6,247 | — | 61.47 | 2/12/2026 | ||||||||||||||||||||||||||||||||
| 36,909 | — | 70.70 | 2/10/2027 | ||||||||||||||||||||||||||||||||
| 27,800 | 13,900 | 71.19 | 2/9/2028 | ||||||||||||||||||||||||||||||||
| 5,873 | 513,124 | ||||||||||||||||||||||||||||||||||
| 1,004 | 87,719 | ||||||||||||||||||||||||||||||||||
| 11,923 | 23,845 | 85.67 | 2/21/2029 | ||||||||||||||||||||||||||||||||
| 5,031 | 439,559 | ||||||||||||||||||||||||||||||||||
| 1,915 | 167,314 | ||||||||||||||||||||||||||||||||||
| — | 28,551 | 111.53 | 2/21/2030 | ||||||||||||||||||||||||||||||||
| 3,981 | 347,820 | ||||||||||||||||||||||||||||||||||
| 2,042 | 178,410 | ||||||||||||||||||||||||||||||||||
Page 59
| Option Awards (1) | Stock Awards | |||||||||||||||||
| Name | Number of Securities Underlying Unexercised Options Exercisable (#) | Number of Securities Underlying Unexercised Options Unexercisable (#) | Equity Incentive Plan Awards: Number of Securities Underlying Unexercised Unearned Options (#) | Option Exercise Price ($) | Option Expiration Date | Number of Shares or Units of Stock That Have Not Vested (#) (2) | Market Value of Shares or Units of Stock That Have Not Vested ($) | Equity Incentive Plan Awards: Number of Unearned Shares, Units or Other Rights That Have Not Vested (#) (2)(3) | Equity Incentive Plan Awards: Market or Payout Value of Unearned Shares, Units or Other Rights That Have Not Vested ($) | |||||||||
| Mr. Johnston | 10,234 | 26.58 | 2/19/2020 | |||||||||||||||
| 7,991 | 34.04 | 2/18/2021 | ||||||||||||||||
| 4,893 | 31.62 | 5/2/2021 | ||||||||||||||||
| 13,472 | 35.63 | 2/17/2022 | ||||||||||||||||
| 13,088 | 44.70 | 2/15/2023 | ||||||||||||||||
| 12,873 | 46.81 | 2/14/2024 | ||||||||||||||||
| 11,768 | 905,901 | |||||||||||||||||
| 13,573 | 52.25 | 2/13/2025 | ||||||||||||||||
| 523 | 40,261 | 11,670 | 898,357 | |||||||||||||||
| 7,845 | 3,923 | 61.47 | 2/12/2026 | |||||||||||||||
| 2,358 | 181,519 | 11,937 | 918,910 | |||||||||||||||
| 25,495 | 50,989 | 70.70 | 12/10/2027 | |||||||||||||||
| 3,618 | 278,517 | |||||||||||||||||
| 84,765 | 71.19 | 2/9/2028 | ||||||||||||||||
| Mr. Scherer | 8,933 | 34.04 | 2/18/2021 | |||||||||||||||
| 664 | 31.62 | 5/2/2021 | ||||||||||||||||
| 10,262 | 35.63 | 2/17/2022 | ||||||||||||||||
| 8,998 | 44.70 | 2/15/2023 | ||||||||||||||||
| 8,850 | 46.81 | 2/14/2024 | ||||||||||||||||
| 8,087 | 52.25 | 2/13/2025 | ||||||||||||||||
| 7,081 | 545,095 | |||||||||||||||||
| 4,721 | 2,360 | 61.47 | 2/12/2026 | |||||||||||||||
| 484 | 37,258 | 6,383 | 491,363 | |||||||||||||||
| 13,945 | 27,890 | 70.70 | 2/10/2027 | |||||||||||||||
| 2,182 | 167,970 | 6,529 | 502,602 | |||||||||||||||
| 46,365 | 71.19 | 2/9/2028 | ||||||||||||||||
| 3,349 | 257,806 | |||||||||||||||||
| Option Awards (1) | Stock Awards | ||||||||||||||||||||||||||||||||||
| Name | Number of Securities Underlying Unexercised Options Exercisable (#) | Number of Securities Underlying Unexercised Options Unexercisable (#) | Equity Incentive Plan Awards: Number of Securities Underlying Unexercised Unearned Options (#) | Option Exercise Price ($) | Option Expiration Date | Number of Shares or Units of Stock That Have Not Vested (#) (2)(3)(4) | Market Value of Shares or Units of Stock That Have Not Vested ($) | Equity Incentive Plan Awards: Number of Unearned Shares, Units or Other Rights That Have Not Vested (#) (2)(3)(4) | Equity Incentive Plan Awards: Market or Payout Value of Unearned Shares, Units or Other Rights That Have Not Vested ($) | ||||||||||||||||||||||||||
| Mr. Hollenbeck | 5,939 | — | 52.25 | 2/13/2025 | |||||||||||||||||||||||||||||||
| 5,150 | — | 61.47 | 2/12/2026 | ||||||||||||||||||||||||||||||||
| 30,810 | — | 70.70 | 2/10/2027 | ||||||||||||||||||||||||||||||||
| 23,207 | 11,603 | 71.19 | 2/9/2028 | ||||||||||||||||||||||||||||||||
| 4,902 | 428,288 | ||||||||||||||||||||||||||||||||||
| 838 | 73,216 | ||||||||||||||||||||||||||||||||||
| 9,952 | 19,905 | 85.67 | 2/21/2029 | ||||||||||||||||||||||||||||||||
| 4,200 | 366,954 | ||||||||||||||||||||||||||||||||||
| 1,436 | 125,463 | ||||||||||||||||||||||||||||||||||
| 23,833 | 111.53 | 2/21/2030 | |||||||||||||||||||||||||||||||||
| 3,323 | 290,331 | ||||||||||||||||||||||||||||||||||
| 1,705 | 148,966 | ||||||||||||||||||||||||||||||||||
| Mr. Mullen | 4,526 | — | 35.63 | 2/17/2022 | |||||||||||||||||||||||||||||||
| 5,126 | — | 44.70 | 2/15/2023 | ||||||||||||||||||||||||||||||||
| 5,208 | — | 46.81 | 2/14/2024 | ||||||||||||||||||||||||||||||||
| 4,782 | — | 52.25 | 2/13/2025 | ||||||||||||||||||||||||||||||||
| 4,207 | — | 61.47 | 12/19/2025 | ||||||||||||||||||||||||||||||||
| 26,011 | — | 70.70 | 12/19/2025 | ||||||||||||||||||||||||||||||||
| 30,367 | — | 71.19 | 12/19/2025 | ||||||||||||||||||||||||||||||||
| 4,277 | 373,682 | ||||||||||||||||||||||||||||||||||
| 731 | 63,867 | ||||||||||||||||||||||||||||||||||
| 26,047 | — | 85.67 | 12/19/2025 | ||||||||||||||||||||||||||||||||
| 3,664 | 320,124 | ||||||||||||||||||||||||||||||||||
| 1,253 | 109,475 | ||||||||||||||||||||||||||||||||||
| 20,792 | — | 111.53 | 12/19/2025 | ||||||||||||||||||||||||||||||||
| 2,899 | 253,286 | ||||||||||||||||||||||||||||||||||
| 1,487 | 129,919 | ||||||||||||||||||||||||||||||||||
Page 60
| Option Awards (1) | Stock Awards | |||||||||||||||||
| Name | Number of Securities Underlying Unexercised Options Exercisable (#) | Number of Securities Underlying Unexercised Options Unexercisable (#) | Equity Incentive Plan Awards: Number of Securities Underlying Unexercised Unearned Options (#) | Option Exercise Price ($) | Option Expiration Date | Number of Shares or Units of Stock That Have Not Vested (#) (2) | Market Value of Shares or Units of Stock That Have Not Vested ($) | Equity Incentive Plan Awards: Number of Unearned Shares, Units or Other Rights That Have Not Vested (#) (2)(3) | Equity Incentive Plan Awards: Market or Payout Value of Unearned Shares, Units or Other Rights That Have Not Vested ($) | |||||||||
| Mr. Sewell | 9,578 | 35.63 | 2/17/2022 | |||||||||||||||
| 8,016 | 44.70 | 2/15/2023 | ||||||||||||||||
| 7,885 | 46.81 | 2/14/2024 | ||||||||||||||||
| 6,247 | 480,894 | |||||||||||||||||
| 7,205 | 52.25 | 2/13/2025 | ||||||||||||||||
| 427 | 32,870 | 5,632 | 433,551 | |||||||||||||||
| 4,165 | 2,082 | 61.47 | 2/12/2026 | |||||||||||||||
| 1,925 | 148,187 | 5,873 | 452,104 | |||||||||||||||
| 12,303 | 24,606 | 70.70 | 2/10/2027 | |||||||||||||||
| 3,012 | 231,864 | |||||||||||||||||
| 41,700 | 71.19 | 2/9/2028 | ||||||||||||||||
| Mr. Hollenbeck | 6,468 | 46.81 | 2/14/2024 | |||||||||||||||
| 5,939 | 52.25 | 2/13/2025 | ||||||||||||||||
| 352 | 27,097 | |||||||||||||||||
| 3,433 | 1,717 | 61.47 | 2/12/2026 | 5,150 | 396,447 | |||||||||||||
| 1,607 | 123,707 | |||||||||||||||||
| 10,270 | 20,540 | 70.70 | 2/10/2027 | 4,701 | 361,883 | |||||||||||||
| 2,514 | 193,528 | |||||||||||||||||
| 34,810 | 71.19 | 2/9/2028 | 4,902 | 377,356 | ||||||||||||||
| Mr. Mullen | 4,016 | 34.04 | 2/18/2021 | |||||||||||||||
| 4,526 | 35.63 | 2/17/2022 | ||||||||||||||||
| 5,126 | 44.70 | 2/15/2023 | ||||||||||||||||
| 5,208 | 46.81 | 2/14/2024 | ||||||||||||||||
| 4,782 | 52.25 | 2/13/2025 | ||||||||||||||||
| 4,207 | 323,855 | |||||||||||||||||
| 2,805 | 1,402 | 61.47 | 2/12/2026 | 288 | 22,170 | |||||||||||||
| 3,969 | 305,534 | |||||||||||||||||
| 8,671 | 17,340 | 70.70 | 2/10/2027 | 1,357 | 104,462 | |||||||||||||
| 4,277 | 329,243 | |||||||||||||||||
| 30,367 | 71.19 | 2/9/2028 | 2,193 | 168,817 | ||||||||||||||
| Option Awards (1) | Stock Awards | ||||||||||||||||||||||||||||||||||
| Name | Number of Securities Underlying Unexercised Options Exercisable (#) | Number of Securities Underlying Unexercised Options Unexercisable (#) | Equity Incentive Plan Awards: Number of Securities Underlying Unexercised Unearned Options (#) | Option Exercise Price ($) | Option Expiration Date | Number of Shares or Units of Stock That Have Not Vested (#) (2)(3)(4) | Market Value of Shares or Units of Stock That Have Not Vested ($) | Equity Incentive Plan Awards: Number of Unearned Shares, Units or Other Rights That Have Not Vested (#) (2)(3)(4) | Equity Incentive Plan Awards: Market or Payout Value of Unearned Shares, Units or Other Rights That Have Not Vested ($) | ||||||||||||||||||||||||||
| Mr. Kellington | 4,947 | — | 46.81 | 2/14/2024 | |||||||||||||||||||||||||||||||
| 4,543 | — | 52.25 | 2/13/2025 | ||||||||||||||||||||||||||||||||
| 4,205 | — | 61.47 | 2/12/2026 | ||||||||||||||||||||||||||||||||
| 24,921 | — | 70.70 | 2/10/2027 | ||||||||||||||||||||||||||||||||
| 18,771 | 9,385 | 71.19 | 2/9/2028 | ||||||||||||||||||||||||||||||||
| 3,965 | 346,422 | ||||||||||||||||||||||||||||||||||
| 678 | 59,237 | ||||||||||||||||||||||||||||||||||
| 8,074 | 16,147 | 85.67 | 2/21/2029 | ||||||||||||||||||||||||||||||||
| 3,407 | 297,670 | ||||||||||||||||||||||||||||||||||
| 1,165 | 101,786 | ||||||||||||||||||||||||||||||||||
| 19,522 | 111.53 | 2/21/2030 | |||||||||||||||||||||||||||||||||
| 2,722 | 237,821 | ||||||||||||||||||||||||||||||||||
| 1,396 | 121,969 | ||||||||||||||||||||||||||||||||||
| Mr. Spray | 3,021 | — | 44.70 | 2/15/2023 | |||||||||||||||||||||||||||||||
| 3,205 | — | 46.81 | 2/14/2024 | ||||||||||||||||||||||||||||||||
| 2,986 | — | 52.25 | 2/13/2025 | ||||||||||||||||||||||||||||||||
| 2,614 | — | 61.47 | 2/12/2026 | ||||||||||||||||||||||||||||||||
| 17,131 | — | 70.70 | 2/10/2027 | ||||||||||||||||||||||||||||||||
| 13,026 | 6,513 | 71.19 | 2/9/2028 | ||||||||||||||||||||||||||||||||
| 2,752 | 240,442 | ||||||||||||||||||||||||||||||||||
| 612 | 53,470 | ||||||||||||||||||||||||||||||||||
| 8,453 | 16,905 | 85.67 | 2/21/2029 | ||||||||||||||||||||||||||||||||
| 3,567 | 311,649 | ||||||||||||||||||||||||||||||||||
| 1,220 | 106,591 | ||||||||||||||||||||||||||||||||||
| — | 22,795 | 111.53 | 2/21/2030 | ||||||||||||||||||||||||||||||||
| 3,179 | 277,749 | ||||||||||||||||||||||||||||||||||
| 1,630 | 142,413 | ||||||||||||||||||||||||||||||||||
(1)One-third of each option award vests and becomes exercisable on the first, second and third anniversaries of the grant, provided the associate remains continuously employed with the company or its subsidiaries. The vesting date of each option is listed in the table below:
| Grant Date | Vesting Dates | Expiration Date | ||||||||||||
| 2/18/2011 | 2/18/2012 | 2/18/2013 | 2/18/2014 | 2/18/2021 | ||||||||||
| 5/2/2011 | 5/2/2012 | 5/2/2013 | 5/2/2014 | 5/2/2021 | ||||||||||
| 5/31/2011 | 5/31/2012 | 5/31/2013 | 5/31/2014 | 5/31/2021 | ||||||||||
| 2/17/2012 | 2/17/2013 | 2/17/2014 | 2/17/2015 | 2/17/2022 | ||||||||||
| 2/15/2013 | 2/15/2014 | 2/15/2015 | 2/15/2016 | 2/15/2023 | ||||||||||
| 2/14/2014 | 2/14/2015 | 2/14/2016 | 2/14/2017 | 2/14/2024 | ||||||||||
| 2/13/2015 | 2/13/2016 | 2/13/2017 | 2/13/2018 | 2/13/2025 | ||||||||||
| 2/12/2016 | 2/12/2017 | 2/12/2018 | 2/12/2019 | 2/12/2026 | ||||||||||
| 2/10/2017 | 2/10/2018 | 2/10/2019 | 2/10/2020 | 2/10/2027 | ||||||||||
| 2/9/2018 | 2/9/2019 | 2/9/2020 | 2/9/2021 | 2/9/2028 | ||||||||||
| 2/21/2019 | 2/21/2020 | 2/21/2021 | 2/21/2022 | 2/21/2029 | ||||||||||
| 2/21/2022 | 2/21/2023 | 2/21/2030 |
(2) One-third of the RSUs granted on February 9, 2018, vested on March 1, 2019, another one-third vested on March 1, 2020, and the final one-third vested on March 1, 2021. PSUs granted on February 9, 2018, vested on March 1, 2021, at the maximum payout level upon achievement of the maximum company-level performance target.
(4) One third of the RSUs granted on February 21, 2020, vested on March 1, 2021, another one-third is scheduled to vest on March 1, 2022, and the final one-third is scheduled to vest on March 1, 2023. PSUs granted on February 21, 2020, are scheduled to vest on March 1, 2023, if company-level performance targets are achieved.
2020 Option Exercises and Stock Vested
| Option Awards | Stock Awards | |||||||||||||
| Name | Number of Shares Acquired on Exercise (#) | Value Realized on Exercise ($) | Number of Shares Acquired on Vesting (#) | Value Realized on Vesting ($) | ||||||||||
| Mr. Johnston | 7,991 | 302,699 | 15,088 | 1,461,725 | ||||||||||
| Mr. Sewell | — | — | 8,556 | 828,905 | ||||||||||
| Mr. Hollenbeck | — | — | 7,061 | 684,070 | ||||||||||
| Mr. Mullen | 1,323 | 186,583 | 6,005 | 581,764 | ||||||||||
| Mr. Kellington | — | — | 5,714 | 553,572 | ||||||||||
| Mr. Spray | 6,361 | 235,849 | 4,416 | 427,822 | ||||||||||
Page 62
| Option Awards | Stock Awards | |||
| Name | Number of Shares Acquired on Exercise (#) | Value Realized on Exercise ($) | Number of Shares Acquired on Vesting (#) | Value Realized on Vesting ($) |
| Mr. Johnston | — | — | 15,577 | 1,155,502 |
| Mr. Scherer | — | — | 9,940 | 737,349 |
| Mr. Sewell | — | — | 8,841 | 655,825 |
| Mr. Hollenbeck | 20,896 | 771,264 | 7,298 | 541,366 |
| Mr. Mullen | — | — | 5,912 | 438,552 |
| Name | Plan Name | Number of Years Credited Service (#) | Present Value of Accumulated Benefit ($) (1) | ||||||||
| Mr. Johnston (2) | Qualified Pension Plan | n/a | — | ||||||||
| Supplemental Retirement Plan | n/a | — | |||||||||
| Mr. Sewell (2) | Qualified Pension Plan | n/a | — | ||||||||
| Supplemental Retirement Plan | n/a | — | |||||||||
| Mr. Hollenbeck (2) | Qualified Pension Plan | n/a | — | ||||||||
| Supplemental Retirement Plan | n/a | — | |||||||||
| Mr. Mullen (3) | Qualified Pension Plan | 40 | 2,063,179 | ||||||||
| Supplemental Retirement Plan | 40 | 2,306,284 | |||||||||
| Mr. Kellington (2) | Qualified Pension Plan | n/a | — | ||||||||
| Supplemental Retirement Plan | n/a | — | |||||||||
| Mr. Spray | Qualified Pension Plan | 30 | 887,752 | ||||||||
| Supplemental Retirement Plan | 30 | 753,594 | |||||||||
| Name | Plan Name | Number of Years Credited Service (#) | Present Value of Accumulated Benefit ($) (1) |
| Mr. Johnston (2) | Qualified Pension Plan | n/a | — |
| Supplemental Retirement Plan | n/a | — | |
| Mr. Scherer (3) | Qualified Pension Plan | 35 | 1,650,097 |
| Supplemental Retirement Plan | 35 | 3,681,371 | |
| Mr. Sewell (2) | Qualified Pension Plan | n/a | — |
| Supplemental Retirement Plan | n/a | — | |
| Mr. Hollenbeck (2) | Qualified Pension Plan | n/a | — |
| Supplemental Retirement Plan | n/a | — | |
| Mr. Mullen (4) | Qualified Pension Plan | 40 | 1,527,572 |
| Supplemental Retirement Plan | 40 | 1,481,242 | |
(1) Amounts listed in the “Present Value of Accumulated Benefit” column were calculated as of December 31, 2020, using the same actuarial assumptions used by the company for GAAP financial reporting purposes and assuming that benefits commence at age 65. The assumptions include a lump-sum factor baseline of 0.25% for both plans and a discount rate of 3.40% in the Qualified Pension Plan and 3.33% in the SERP.
(2) Messrs. Johnston, Kellington and Sewell joined the company after entry into the qualified pension plan was closed. Mr. Hollenbeck elected to leave the retirement plans in 2008 in connection with changes to the plans.
(3) Mr. Mullen retired on December 18, 2020. His Qualified Pension Plan benefit was distributed on January 1, 2021. Distribution of his SERP benefit was delayed as a matter of law and in accordance with the Plan for six months following his separation from service.
Tax-qualified defined benefit pension plan - The Cincinnati Financial Corporation Retirement Plan (Retirement Plan) is a tax-qualified defined benefit pension plan available to all full-time associates ages 40 and over on August 31, 2008, who elected to remain in the plan effective September 1, 2008. Members who were actively employed by the company on June 30, 2008, became fully vested in their accrued benefit. The Retirement Plan is closed to new members. Members of the Retirement Plan earn one year of service for each calendar year in which they work at least 1,000 hours. Members also earn service for time that they are paid, or entitled to be paid, but do not actually work. These times include vacation, holidays, illness, military duty and some periods of disability. Generally, the maximum amount of service that may be earned under the Retirement Plan is 40 years. There are no deductions for Social Security or other offset amounts.
The Retirement Plan defines earnings for any given plan year as the base rate of salary in effect on the last day of the plan year, subject to the maximum recognizable compensation under Section 401(a)(17) of the Internal Revenue Code. Bonuses, stock-based awards and other forms of compensation do not contribute to earnings under the Retirement Plan.
Normal retirement age as defined in the Retirement Plan is age 65. The normal retirement pension is computed as a single life annuity. The normal monthly benefit payment is the greatest of the following threetwo calculated amounts:
The first calculated amount is the sum of:
1.0.45% of the member’s average monthly earnings plus 1.35% of the member’s average monthly earnings up to $2,916.67; multiplied by years of service up to 15 years, plus
2.0.60% of the member's average monthly earnings plus 1.8% of the member’s average monthly earnings up to $2,916.67; multiplied by years of service between 16 and 40.
Page 63
The second calculated amount is the sum of:
2.1.2% of 50 years.the member’s final average earnings; multiplied by years of service between 16 and 40.
The normal form of benefit payment under the terms of the Retirement Plan is a single life annuity for unmarried members and a joint and 50 percent50% survivor annuity for married members. The plan permits members to elect to receive payment of benefits in the following forms:
•Single life only
•Single life only with 60-month or 120-month guarantee
•Joint and 50 percent50% contingent annuity
•Joint and 66.67 percent66.67% contingent annuity
•Joint and 75 percent75% contingent annuity
•Joint and 100 percent100% contingent annuity
•Lump sum
Alternative forms of benefit payment are offered to provide plan members some flexibility in retirement income and estate planning by giving them the option of electing monthly benefits with or without a survivor’s benefit. Generally, the single life annuity alternative provides the largest monthly benefit but does not provide a survivor’s benefit. All other payment forms are the actuarial equivalent of a single life annuity. Alternatives other than the single life annuity provide slightly lower monthly benefits to the plan member, depending on such factors as presence of survivor’s benefit, the member’s age and any contingent annuitant’s age. The lump sum payment permits plan members to roll the present value of their benefit into an Individual Retirement Account and defer income taxes until the member withdraws funds from that account.
Supplemental retirement plan - The second retirement plan in which some named executive officers participate is the Cincinnati Financial Corporation Supplemental Retirement Plan (SERP). The SERP is unfunded and subject to forfeiture in the event of bankruptcy.
The SERP is a nontax-qualified defined benefit plan maintained by the company to pay eligible associates the difference between the amount payable under the tax-qualified defined benefit plan and the amount they would have received without the tax-qualified plan’s limit due to Section 401(a)(17) and Section 415 of the Internal Revenue Code. Accordingly, the SERP definitions for service, normal retirement age and annual earnings are the same as those for the Retirement Plan except the SERP’s definition of annual earnings is not limited.
The normal retirement benefit under the SERP for the participating named executive officers will be equal to the excess of the member’s monthly benefit under the Retirement Plan as of the member’s retirement date, without regard to the limit on earnings under Section 401(a)(17) of the Internal Revenue Code and without regard to any limit on benefits under Section 415 of the Internal Revenue Code. The pension benefit under the SERP is payable only in the form of a single lump sum.
Both retirement plans permit early retirement, provided the member has at least five years of service. Benefits for early retirement are calculated by adjusting for life expectancy and reducing the benefit payable at age 65 by 0.5 percent0.5% per month for each month prior to age 65 that the member elects to begin receiving pension benefits. For example, a member who elects to retire at age 60 would receive 70 percent70% (60 months X 0.5 percent0.5% = 30 percent30% reduction) of the life-expectancy adjusted benefit payable at age 65.
Page 64
Actuarial work related to both the Retirement Plan and SERP is performed by Willis Towers Watson, which provides human resource strategy, design and management; actuarial and management consulting to the financial services industry; and reinsurance intermediary services. The Committee engaged Willis Towers Watson to provide actuarial and consultative services related to the design of the company’s retirement and employee benefit plans.
| Name | Aggregate Balance at 2019 Year-End | Executive Contributions in 2020 | Registrant Contributions in 2020 | Aggregate Earnings in 2020 | Aggregate Balance at 2020 Year-End | ||||||||||||
| ($) | ($) (3) | ($) (4) | ($) | ($) (5) | |||||||||||||
| Mr. Johnston | 12,758,664 | 1,235,907 | 190,859 | (1,981,232) | 12,204,198 | ||||||||||||
| Mr. Sewell | 5,157,358 | 387,356 | 108,295 | 1,728,395 | 7,381,405 | ||||||||||||
| Mr. Hollenbeck | 2,476,049 | 902,048 | 87,574 | 635,357 | 4,101,027 | ||||||||||||
| Mr. Mullen | 23,127 | — | — | 2,396 | 25,523 | ||||||||||||
| Mr. Kellington | 1,251,498 | 219,858 | 68,118 | 237,403 | 1,776,877 | ||||||||||||
| Mr. Spray | — | — | — | — | — | ||||||||||||
| Name | Aggregate Balance at 2017 Year-End | Executive Contributions in 2018 | Registrant Contributions in 2018 | Aggregate Earnings in 2018 | Aggregate Balance at 2018 Year-End |
| ($) | ($) (3) | ($) (4) | ($) | ($) (5) | |
| Mr. Johnston | 7,207,928 | 1,161,523 | 177,023 | 512,279 | 9,058,753 |
| Mr. Scherer | 2,302,781 | 94,915 | — | (197,700) | 2,199,996 |
| Mr. Sewell | 3,071,658 | 541,904 | 98,273 | 9,232 | 3,721,067 |
| Mr. Hollenbeck | 1,383,086 | 186,731 | 79,308 | (13,637) | 1,635,488 |
| Mr. Mullen | 20,592 | — | — | (2,456) | 18,136 |
(1) Prior to 2009 the company did not contribute to the Top Hat Savings Plan.
(2) No withdrawals or distributions occurred in 2020.
(3) The named executive officers’ contributions shown in this column are also reported in the Summary Compensation Table in the Salary column, and included in the amounts shown for total compensation.
(4) The amounts shown in this column reflect the company’s match of the eligible named executive officer’s contributions, up to 6% of the portion of their cash compensation that exceeds $285,000 and is reported in the All Other Compensation column of the Summary Compensation Table.
(5) Of the amounts shown in this column, $5,099,937; $2,281,259; $935,763; $0; $0; and $0 for Messrs. Johnston, Sewell, Hollenbeck, Mullen, Kellington and Spray, respectively, were reported in the Summary Compensation Table in prior years.
Defined contribution plans - The company sponsors a tax-qualified 401(k) savings plan for all associates as well as the Cincinnati Financial Corporation Top Hat Savings Plan, a deferred compensation plan for a select group of management or certain highly compensated associates. Fidelity Management Trust Company is the third-party administrator of the company’s defined contribution plans. The company made no cash contributions to the 401(k) or Top Hat plans until September 2008. In connection with Retirement Plan changes effective September 1, 2008, the company began to match contributions to the 401(k) plan made by associates who are not members of the Retirement Plan, up to a maximum of 6 percent6% of the associate’s annual cash compensation (salary and annual incentive compensation award). Participants in the Top Hat Savings Plan do not receive a matching contribution from the company unless their compensation level exceeds the maximum recognizable compensation under Section 401(a)(17) of the Internal Revenue Code, which for 20182020 was $275,000.$285,000. Contributions made by associates immediately vest, while company matching contributions vest after three years of service. Messrs. Johnston, Sewell, Hollenbeck and HollenbeckKellington participate in these defined contribution plans and receive company matches of contributions made in each up to the 6 percent6% maximum. Messrs. Scherer andMr. Mullen also havehas participated in these plans, but they dohe has not receivereceived the company match because they are participantshe is a participant in the defined benefit Retirement Plan and SERP. Mr. Spray has not participated in the defined contribution plans.
Compensation payable to the named executive officers may be deferred pursuant to the Top Hat Savings Plan. Under the Top Hat Savings Plan, highly compensated individuals as defined by the plan, including the named executive officers, may elect to defer a percentage of salary, any discretionary bonus and any annual incentive compensation, less the required withholdings. Deferral elections are made before the plan year for which compensation is to be deferred and are effective for the entire year. These elections generally may not be modified or terminated for that year. Compensation deferred by the named executive officer is credited to the individual’s deferred compensation account maintained by the company.
Page 65
Beginning in 2008, in connection with the company’s redesign of our retirement benefit plans, we amended the Top Hat Savings Plan to eliminate the prior cap on the amount of salary that may be deferred and to permit company matching contributions for certain officers who have contributed to and received the maximum company match allowable in their 401(k) accounts, yet due to tax law limitations, are unable to receive a matching contribution for the compensation that exceeds the limit imposed on tax-qualified 401(k) plans. We do not otherwise contribute to or match contributions to this plan. Participants are prohibited from borrowing or pledging amounts credited to their accounts. Under the defined contribution plans, individuals choose one or more of several specified investment alternatives, including an alternative for Cincinnati Financial Corporation common stock. Earnings credited to the participant’s account are calculated based on the performance of the applicable investment choice(s) selected by the participant. We do not guarantee any level of return on contributions to the Top Hat Savings Plan.
Distributions from the Top Hat Savings Plan are made as soon as legally and administratively feasible after retirement, other separation from service or death, or pursuant to a qualified domestic relations order. Distributions to the named executive officers due to retirement or other separation of service are not permitted until the earlier of 180 days after employment terminates or death. Other than distributions pursuant to qualified domestic relations orders, distributions are made in the form of either a single lump-sum payment or monthly installments of not less than 12 months or more than 120 months, depending upon the participant’s prior election. To the extent that a participant chooses to have earnings credited based on the Cincinnati Financial Corporation common stock election, the participant may choose to receive any benefit payments in the form of stock. All other distributions are made in cash.
Potential Payments Upon Termination or Change of Control
We do not have employment contracts or severance plans applicable to any of our named executive officers. Assuming a termination of employment on December 31, 2018,2020, amounts the named executive officer would receive are governed by the terms of our qualified and nonqualified defined benefit and defined contribution plans, our various stock compensation plans and the 2009 Annual Incentive Compensation Plan. Generally, upon termination of employment for any reason, the named executive officer would be entitled to receive the balance of the Top Hat Savings Plan account disclosed in the Aggregated Balance at 20182020 Year-End column of the 20182020 Nonqualified Deferred Compensation Plan table. Additionally, individual named executive officers would be entitled to receive the amounts set forth in the table below, depending on age and the nature of the termination.
Page 66
Potential Payments Upon Termination
| Name | Top Hat Savings Plan | Retirement Plan | SERP | Stock-Based Awards | Annual Incentive Compensation | |||||||||||||||||||||||||||
| Retirement | Retirement with Disability | Change in Control | Retirement | Retirement with Disability | Change in Control | |||||||||||||||||||||||||||
| ($) | ($) | ($) | ($) | ($) | ($) | ($) | ($) | ($) | ||||||||||||||||||||||||
| Mr. Johnston | (1) | 12,204,198 | — | — | — | 4,939,573 | 4,939,573 | — | 410,175 | 410,175 | ||||||||||||||||||||||
| Mr. Sewell | (1) | 7,381,405 | — | — | — | 2,728,509 | 2,728,509 | — | 204,907 | 204,907 | ||||||||||||||||||||||
| Mr. Hollenbeck | (2) | 4,101,027 | — | — | — | 2,256,364 | 2,256,364 | — | 171,045 | 171,045 | ||||||||||||||||||||||
| Mr. Mullen | (3) | 25,523 | 2,063,179 | 2,306,284 | 1,482,709 | — | — | 149,220 | — | — | ||||||||||||||||||||||
| Mr. Kellington | (1) | 1,776,877 | — | — | — | 1,831,054 | 1,831,054 | — | 140,107 | 140,107 | ||||||||||||||||||||||
| Mr. Spray | (4) | — | 959,747 | 801,321 | — | 1,651,714 | 1,651,714 | — | 163,597 | 163,597 | ||||||||||||||||||||||
(1) Messrs. Johnston, Sewell and Kellington were hired after entry into the defined benefit pension plan was closed and, therefore, were never members of the pension plan or the SERP. If any retired due to a disability or terminated employment because of change of control, he would receive accelerated vesting of certain outstanding stock-based awards under the 2006, 2012 and 2016 Stock Compensation Plans and outstanding annual incentive compensation awards at levels determined by company performance. The amounts shown for Messrs. Johnston, Sewell and Kellington include threshold and maximum values for annual incentive compensation and stock-based awards, respectively, for performance periods ending December 31, 2020 and target levels for performance-based stock awards with performance periods ending after December 31, 2020. For any other termination of employment, none would not receive accelerated vesting of such awards because they have not attained age 65 and have not been employed with the company for 35 years.
(2) Mr. Hollenbeck elected to leave the defined benefit plan in 2008, in connection with the company’s restructuring of its retirement benefits. If he retired due to a disability or terminated employment because of change of control, he would receive accelerated vesting of certain outstanding stock-based awards under the 2006, 2012 and 2016 Stock Compensation Plans and outstanding annual incentive compensation awards at levels determined by company performance. For any other termination of employment, he would not receive accelerated vesting of such awards because he has not attained age 65 and has not been employed with the company for 35 years. The amount shown for Mr. Hollenbeck includes threshold and maximum values for annual incentive compensation and stock-based awards, respectively, for performance periods ending December 31, 2020 and target levels for performance-based stock awards with performance periods ending after December 31, 2020.
(3) Mr. Mullen retired on December 18, 2020. Under the terms of the Plan, his Qualified Pension Plan benefit was paid on January 1, 2021. Distribution of Mr. Mullen's Top Hat Savings Plan and SERP benefits were delayed as a matter of law and in accordance with the Plan for six months following separation from service. Vesting of Mr. Mullen's annual incentive compensation and stock-based awards occurred upon retirement subject to the terms of the individual grant agreements, including determination by the Committee of achievement of company-level performance goals. The amount shown for Mr. Mullen includes threshold and maximum values for annual incentive and stock based awards respectively, for the performance period ending December 31, 2020.
(4) Mr. Spray is a participant in the Retirement Plan and the SERP. If he retired due to a disability or terminated employment because of a change of control, he would receive accelerated vesting at target levels of outstanding stock-based awards under the 2006, 2012 and 2016 Stock Compensation Plans and outstanding awards of annual incentive compensation under the 2009 Annual Incentive Plan. The amount shown for Mr. Spray includes threshold and maximum values for annual incentive compensation and stock-based awards, respectively, for performance periods ending December 31, 2020 and target levels for performance-based stock awards with performance periods ending after December 31, 2020. For any other termination of employment, Mr. Spray would not receive accelerated vesting of such awards because he has not attained age 65 and has not been employed with the company for 35 years.
Page 67
| Name | Top Hat Savings Plan | Retirement Plan | SERP | Stock-Based Awards | Annual Incentive Compensation | ||||||||||||||
| Retirement | Retirement with Disability | Change in Control | Retirement | Retirement with Disability | Change in Control | ||||||||||||||
| ($) | ($) | ($) | ($) | ($) | ($) | ($) | ($) | ($) | |||||||||||
| Mr. Johnston | (1) | 9,058,753 | — | — | — | 4,603,412 | 4,603,412 | — | 1,133,000 | 1,133,000 | |||||||||
| Mr. Scherer | (2) | 2,199,996 | 1,650,097 | 3,681,371 | 2,230,785 | 2,818,480 | 2,818,480 | 185,918 | 619,725 | 619,725 | |||||||||
| Mr. Sewell | (1) | 3,721,067 | — | — | — | 2,504,714 | 2,504,714 | — | 557,375 | 557,375 | |||||||||
| Mr. Hollenbeck | (3) | 1,635,488 | — | — | — | 2,084,026 | 2,084,026 | — | 465,273 | 465,273 | |||||||||
| Mr. Mullen | (4) | 18,136 | 1,784,211 | 1,727,856 | 1,395,193 | 1,767,119 | 1,767,119 | 121,767 | 405,889 | 405,889 | |||||||||
Audit-Related Matters
Proposal 3 - Ratifying the Selection of the Independent Registered Public Accounting Firm
The audit committee has selected the firm of Deloitte & Touche LLP as the company’s independent registered public accounting firm for 2019.2021. Although action by shareholders in this matter is not required, the audit committee believes that it is appropriate to seek shareholder ratification of this selection and to seriously consider shareholder opinion on this issue.
Representatives from Deloitte & Touche LLP, which also served as the company’s independent registered public accounting firm for the last calendar year, will be present at the 20192021 Annual Meeting of Shareholders and will be afforded the opportunity to make any statements they wish and to answer appropriate questions.
Vote Required
The board of directors recommends a vote FOR the resolution ratifying the selection of Deloitte & Touche LLP as the company’s independent registered public accounting firm for 2019.2021.
Report of the Audit Committee
The audit committee is responsible for monitoring the integrity of the company’s consolidated financial statements, the company’s system of internal controls, the qualifications and independence of the company’s independent registered accounting firm, the performance of the company’s internal audit department and independent registered accounting firm and the company’s compliance with certain legal and regulatory requirements. The committee has sole authority and responsibility to select, determine the compensation of, and evaluate the company’s independent registered accounting firm. The committee has nineseven independent directors and operates under a written charter. The board has determined that each committee member is independent under the standards of director independence established by the Nasdaq listing requirements and is also independent for purposes of Section 10A(m)(3) of the Exchange Act.
Management is responsible for the financial reporting process, including the system of internal controls; for the preparation of consolidated financial statements in accordance with generally accepted accounting principles; and for the report on the company’s internal control over financial reporting. The company’s independent registered public accounting firm is responsible for auditing those financial statements and expressing an opinion as to their conformity with accounting principles generally accepted in the United States of America. The committee’s responsibility is to oversee and review the financial reporting process and to review and discuss management’s report on the company’s internal control over financial reporting. However, the committee is not professionally engaged in the practice of accounting or auditing and does not provide any expert or special assurance as to such financial statements concerning compliance with laws, regulations or generally accepted accounting principles or as to auditor independence. The committee relies, without independent verification, on the information provided to it and on the representations made by management and the independent registered accounting firm.
Page 68
The committee reviewed and discussed the audited consolidated financial statements for the fiscal year ended December 31, 2018,2020, with management, the internal auditors and Deloitte & Touche LLP. The committee also discussed with management, the internal auditors and Deloitte & Touche LLP the process used to support certifications by the company’s chief executive officer and chief financial officer that are required by the SEC and the Sarbanes-Oxley Act of 2002 to accompany the company’s periodic filings with the SEC and the processes used to support management’s annual report on the company’s internal controls over financial reporting.
The committee also discussed with Deloitte & Touche LLP matters that independent registered public accounting firms must discuss with audit committees under generally accepted auditing standards and standards of the Public Company Accounting Oversight Board (PCAOB), including, among other matters, those related to the conduct of the audit of the company’s consolidated financial statements and those required to be discussed by AICPA Auditing Standards No. 61, codified into AICPA, Professional Standards, Vol. 1. AU Section 380 and PCAOB Auditing Standard No. 16 - Communications with Audit Committees, effective pursuant to SEC Release No. 34-68453 (December 17, 2012). The committee has received the written disclosures and the letter from Deloitte & Touche LLP required by applicable standards of the PCAOB regarding its communications with the committee concerning independence, and the committee has discussed with Deloitte & Touche LLP its independence from the company. The committee considered whether services Deloitte & Touche LLP provided to the company beyond those rendered in connection with its audit of the company’s consolidated financial statements and its reviews of the company’s interim condensed consolidated financial statements included in its Quarterly Reports on Form 10-Q were compatible with maintaining its independence. The committee also reviewed, among other things, the audit, audit-related and tax services performed by Deloitte & Touche LLP, and the amount of fees paid for such services. The committee received regular updates on the amount of fees and scope of audit, audit-related and tax services provided.
Based on the above-mentioned review and these meetings, discussions and reports, and subject to the limitations on the committee’s role and responsibilities referred to above and in the committee’s charter, the committee recommended to the board that the company’s audited consolidated financial statements for the fiscal year ended December 31, 2018,2020, be included in the company’s Annual Report on Form 10-K. The committee also selected Deloitte & Touche LLP as the company’s independent registered accounting firm for the fiscal year ending December 31, 2019,2021, and is presenting the selection to the shareholders for ratification at the 20192021 Annual Meeting of Shareholders.
Submitted by the audit committee:
Thomas J. Aaron, William F. Bahl, Gregory T. Bier, Linda W. Clement-Holmes, Dirk J. Debbink, Kenneth C. Lichtendahl,Jill P. Meyer, David P. Osborn, and Gretchen W. Price (chair), Douglas S. Skidmore and John F. Steele, Jr.Schar (Chair)
Page 69
Fees Billed by the Independent Registered Public Accounting Firm
The audit committee engaged Deloitte & Touche LLP to perform an annual audit of the company’s financial statements for the year ended December 31, 2018.2020.
| Year Ended December 31, | |||||||||||
| 2020 | 2019 | ||||||||||
| Audit Fees | $ | 3,466,978 | $ | 3,615,819 | |||||||
| Audit-Related Fees | 175,000 | 98,000 | |||||||||
| Tax Fees | 967,980 | 1,038,918 | |||||||||
| Subtotal | 4,609,958 | 4,752,737 | |||||||||
| All Other Fees | 2,018 | 574,767 | |||||||||
| Deloitte & Touche LLP Total Fees | $ | 4,611,976 | $ | 5,327,504 | |||||||
| Year Ended December 31, | |||||||
| 2018 | 2017 | ||||||
| Audit Fees | $ | 2,880,500 | $ | 2,620,500 | |||
| Audit-Related Fees | 1,360,810 | 147,000 | |||||
| Tax Fees | 818,446 | 877,254 | |||||
| Subtotal | 5,059,756 | 3,644,754 | |||||
| All Other Fees | 514,999 | 2,018 | |||||
| Deloitte & Touche LLP Total Fees | $ | 5,574,755 | $ | 3,646,772 | |||
Services Provided by the Independent Registered Public Accounting Firm
All services rendered by the independent registered public accounting firm are permissible under applicable laws and regulations. In 20182020 and 2017,2019, all services rendered by the independent registered accounting firm were preapproved by the audit committee, and no fees were charged pursuant to the de minimis safe harbor exception to the preapproval requirement described in the audit committee charter.
Under the preapproval policy, the audit committee preapproves specific services related to the primary service categories of audit services, audit-related services, tax services and other services. A one-time preapproval dollar limit for specified services related to a specific primary category is established for the audit period. Examples of nonaudit services specified under the policy requiring preapproval may include: financial and tax due diligence, benefit plan audits, American Institute of Certified Public Accountants (AICPA) agreed-upon procedures, security and privacy control-related assessments, technology control assessments, technology quality assurance, financial reporting control assessments, enterprise security architecture assessment, tax controversy advice (IRS examinations), sales tax and lease compliance, employee benefit tax, tax compliance and support, tax research, allowable actuarial reviews and advice and financial and internal control training.
The committee must individually approve engagements for permissible services. All engagements are periodically reported to the audit committee. The preapproval of potential services can be provided by the audit committee chair as a delegate of the audit committee. The audit committee chair reports any such preapproved services to the committee at its next meeting. Pursuant to the rules of the SEC, the fees billed by the independent registered public accounting firm for services are disclosed in the table above.
Audit Fees - For professional services performed by the independent registered public accounting firm for the integrated audit of the company’s annual financial statements; review of financial statements included in our Form 10-K and Form 10-Q filings; and services that are normally provided in connection with statutory and regulatory filings or engagements.
Audit-Related Fees - For assurance and related services performed by the independent registered public accounting firm that are reasonably related to the performance of the audit or review of our financial statements. These services include employee benefit plan audits, agreed-upon procedures, financial and tax due diligence in connection with our acquisition of MSP Underwriters Ltd.,Cincinnati Global, and statements of actuarial opinion.
Page 70
Tax Fees - For professional services performed by the independent registered public accounting firm with respect to tax controversy advice, tax compliance and support, tax research, employee benefit compliance and advice, tax advice in connection with our acquisition of MSP Underwriting Ltd.,Cincinnati Global, and sales and use tax advice. None of the tax fees in 20182020 or 20172019 were related to tax advice, planning or consulting for retired executives. Our independent registered public accounting firm does not perform any tax shelter work on our behalf.
All Other Fees - For integration planning and advisory services in connection with the company's acquisition of MSP Underwriting Ltd.,Cincinnati Global, training provided to the company’s internal audit department and the company’s use of an accounting research tool.
Page 71
Frequently Asked Questions
Why are these materials important?
The board of directors of Cincinnati Financial Corporation is soliciting your vote for the 20192021 Annual Meeting of Shareholders. Shareholders of record at the close of business on February 28, 2019,March 10, 2021, may vote. You have one vote for each share of common stock you owned on that date. There were 163,127,889161,040,098 shares of common stock outstanding as of the close of business on February 28, 2019.March 10, 2021. A majority of the outstanding shares, or 81,563,94580,520,050 shares, must be represented to hold the meeting. This constitutes a quorum.
How do I vote?
You may vote by proxy, whether or not you register for and attend the virtual shareholder meeting. Even if you plan to attend the annualvirtual shareholder meeting, we ask that you vote your shares in one of the ways listed below. Attending the virtual shareholder meeting does not constitute a revocation of a previously submitted vote. If you wish to vote during the virtual shareholder meeting, you can do so by following instructions that will be available on the virtual meeting website during the meeting.
A Notice Regarding the Availability of Proxy Materials will be provided to you by mail in late March, unless you previously requested for these materials to be delivered to you in paper or by email. The Notice includes instructions for viewing our year-end 20182020 financial materials and proxy statement online and for voting via the internet, by telephone or by mail, along with the required Control Number (the Control Number is unique to each account). The Notice also includes instructions on how to request paper materials.
Shareholders who previously requested paper or email delivery of all materials will receive the 20182020 Annual Report on Form 10-K, the 20192021 Annual Letter from the Chairmanto Shareholders and the Chief Executive Officer and the 20192021 Shareholder Meeting Notice and Proxy Statement in late March or early April.
Page 72
If you are a Shareholder of Record who owns shares directly in your name, you may vote your shares in one of the following ways:
 | By telephone. You may vote your shares by calling 1-866-804-9616. | |||||||
 | Over the internet. Go to AALvote.com/cinf. You will need to have your Control Number available when you access the website. Your Control Number is on the Notice or proxy card that you received in the mail. | |||||||
  | By scanning the QR code on your proxy card or Notice with your mobile device. The QR code on your proxy card or Notice is a unique identifier so you will not need to enter a Control Number. If you scan the QR code with your mobile device, you will access our proxy materials along with a voting screen. | |||||||
 | By mail. If you received printed proxy materials, you may submit your vote by completing, signing and dating each proxy card received and returning it in the prepaid envelope. Sign your name exactly as it appears on the proxy card. Be sure to return your proxy card in time to be received and counted before the Annual Meeting. | |||||||
 | ||||||||
If you vote by telephone or via the internet at AALvote.com/cinf or by scanning the QR code with your mobile device, you must vote no later than 11:59 p.m. ET on April 26, 2019.May 7, 2021. You do not need to return a proxy card by mail. Voting electronically or by telephone is convenient, reduces the use of natural resources and saves significant postage and processing costs. Your vote is also recorded immediately and there is no risk that postal delays could cause your vote to arrive late and therefore not be counted.
If you are a Beneficial Shareholder who owns shares indirectly through a bank, broker or other nominee, you should follow the instructions in the Notice or voting instructions that you receive from the broker or other nominee holding your shares. Beneficial Shareholders include current and former company associates who hold shares in the Cincinnati Financial Corporation Savings Plan. The availability of telephone and internet voting will depend on the voting process of your broker or nominee. Shares held beneficially may be voted in person at the Annual Meeting only if you obtainprovide, during registration for the Annual Meeting, a legal proxy from your broker or nominee giving you the right to vote the shares.
How do I locate my Control Number?
If you receive our information in the mail, the Control Number is on the Notice or proxy card that also indicates your name and the number of shares you own. If you receive our information electronically, the Control Number is in the text of the email. If you are a Shareholder of Record, you may also obtain your Control Number by calling 1-877-777-2857.1-855-200-8057. If you are a Beneficial Shareholder, your bank, broker or other nominee can provide your Control Number.
Page 73
Can I obtain another proxy card so I can vote by mail?
If you are a Shareholder of Record, you may obtain another proxy card by calling 1-877-777-2857. If you are a Beneficial Shareholder, your bank, broker or other nominee can supply another voting instruction form.
Can my shares be voted if I don’t return my proxy or voting instructions and don’t register for and attend the virtual annual shareholder meeting?
If you are a Shareholder of Record, the answer is no. If you are a Beneficial Shareholder and you do not direct your nominee as to how to vote your shares, applicable rules provide that the nominee generally may vote your shares on any of the routine matters scheduled to come before the meeting. The proposal to ratify the selection of the independent registered public accounting firm is believed to be the only routine matter scheduled to come before this year’s annual meeting. If your nominee indicates on a proxy that it does not have discretionary authority to vote certain shares on a particular matter, these shares (called broker nonvotes) are counted as present in determining whether we have a quorum but have no effect on the votes required to elect directors or to approve compensation for our named executive officers.
Can I change my vote or revoke my proxy?
Yes. Simply cast a new vote by internet or telephone or send in a new signed proxy card with a later date. If you are a Shareholder of Record, you may send a written notice of revocation to the corporate secretary of the company. If you hold shares directly in your name, register for and virtually attend the annual meeting, you also may choose to vote in person. Atduring the meeting you can request a ballot and directby following instructions that your previously submitted proxy notwill be used.available on the virtual meeting website during the meeting.
How are the votes counted?
Votes cast by proxy are tabulated prior to the meeting by the holders of the proxies. Inspectors of election appointed at the meeting count the votes and announce the preliminary results at the meeting. The proxy agent reserves the right not to vote any proxies that are altered in a manner not intended by the instructions contained in the proxy. The company publicly discloses the final voting results in a Form 8-K filing after the vote count is certified, usually within a week of the meeting.
Could other matters be decided at the meeting?
We do not know of any matters to be considered at the annual meeting other than the election of directors and the proposals described in this proxy statement. For any other matters that do properly come before the meeting, your shares will be voted at the discretion of the proxy holder.
Can I listen to the meeting if I cannot attend in person?do not register for the virtual annual shareholder meeting?
How can I obtain a 20182020 Annual Report?
You can obtain our 20182020 Annual Report on Form 10-K as filed with the SEC at no cost in several ways. You may view, search or print the document online from cinfin.com/investors or viewproxy.com/cinfin/20182021. You may ask that a copy be mailed to you by contacting the corporate secretary of Cincinnati Financial Corporation. Or, you may request it directly from Shareholder Services. Please see the Investor Contacts page of cinfin.com/investors for details. These contacts are also listed at the end of this proxy statement.
Conclusion
Shareholder Proposals, Director Nominations and Important Dates
Shareholder Proposals for Inclusion in the Proxy Statement for the 20202022 Annual Shareholder Meeting
Any qualified shareholder who wishes to present a proposal for action at the 20202022 Annual Meeting of Shareholders must submit the proposal to Cincinnati Financial Corporation, Attn: Lisa A. Love, Corporate Secretary, P.O. Box 145496, Cincinnati, Ohio 45250-5496, on or before November 14, 2019,24, 2021, to be included in our proxy statement for the 20202022 Annual Meeting of Shareholders. Any such proposal must conform to the rules and regulations of the SEC and otherwise be in accordance with other federal laws as well as the laws of the State of Ohio. If the date of the 20202022 Annual Meeting of Shareholders is not within 30 days of April 27, 2020,May 8, 2022, the deadline will be a reasonable time before we begin to print and mail the proxy materials for the 20202022 annual meeting. In addition, the proxy solicited by the board for the 20202022 annual meeting will confer discretionary authority on the persons named in such proxy to vote on any shareholder proposal presented at that meeting if we receive notice of such proposal later than January 28, 2020,February 7, 2022, without the matter having been discussed in such proxy.
Director Nominations for Inclusion in the Proxy Statement for the 20202022 Annual Shareholder Meeting
Other Proposals or Director Nominations for Presentation at the 20202022 Annual Shareholder Meeting
Any qualified shareholder who wishes to present a proposal for action or for nomination of a candidate for election to our board of directors at the 20202022 Annual Meeting of Shareholders (other than any proposal made pursuant to Rule 14a-8 under the Securities and Exchange Act of 1934 or nomination of a director candidate using proxy access) must deliver a notice of the proposal, in the form required by Section 6 of our Code of Regulations, to our corporate secretary on or before February 27, 2020,March 9, 2022, but not before January 18, 2020,28, 2022, or the shareholder’s proposal will not be permitted to be brought before the 20202022 Annual Meeting of Shareholders.
Page 75
Cost of Solicitation
Proxies may be solicited by our directors, officers or other employees, either in person or by mail, telephone or email. The cost of soliciting proxies will be borne by the company. We have contracted with Alliance Advisors LLC to provide internet and telephone voting service for our direct shareholders of record. We ask banks, brokerage houses, other custodians, nominees and fiduciaries to forward copies of the proxy materials to beneficial owners of shares or to request authority for the execution of proxies; and we have agreed to reimburse reasonable out-of-pocket expenses incurred. We have retained the services of Alliance Advisors LLC, a proxy solicitation firm, to assist us in soliciting proxies for the 20192021 Annual Meeting of Shareholders. The cost of such services is estimated at $12,500$10,000 plus out-of-pocket expenses.
Other Business
Management does not know of any other matter or business that may be brought before the meeting; but if any other matter or business properly comes before the meeting, it is intended that a vote will be cast pursuant to the accompanying proxy in accordance with the judgment of the person or persons voting the same.
/S/ Lisa A. Love
Lisa A. Love, Esq.
Senior Vice President, General Counsel and Corporate Secretary
March 13, 201924, 2021
Cincinnati Financial Corporation
Page 76
Appendix A
Definitions of Non-GAAP Information and Reconciliation to Comparable GAAP Measures
(See attached tables for reconciliations; additional prior-period reconciliations available at cinfin.com/investors.)
Cincinnati Financial Corporation prepares its public financial statements in conformity with accounting principles generally accepted in the United States of America (GAAP). Statutory data is prepared in accordance with statutory accounting rules for insurance company regulation in the United States of America as defined by the National Association of Insurance Commissioners’ (NAIC) Accounting Practices and Procedures Manual, and therefore is not reconciled to GAAP data.
Management uses certain non-GAAP financial measures to evaluate its primary business areas – property casualty insurance, life insurance and investments. Management uses these measures when analyzing both GAAP and non-GAAP results to improve its understanding of trends in the underlying business and to help avoid incorrect or misleading assumptions and conclusions about the success or failure of company strategies. Management adjustments to GAAP measures generally: apply to non-recurring events that are unrelated to business performance and distort short-term results; involve values that fluctuate based on events outside of management’s control; supplement reporting segment disclosures with disclosures for a subsidiary company or for a combination of subsidiaries or reporting segments; or relate to accounting refinements that affect comparability between periods, creating a need to analyze data on the same basis.
•Non-GAAP operating income: Non-GAAP operating income is calculated by excluding investment gains and losses (defined as investment gains and losses after applicable federal and state income taxes) and other significant non-recurring items from net income. Management evaluates non-GAAP operating income to measure the success of pricing, rate and underwriting strategies. While investment gains (or losses) are integral to the company’s insurance operations over the long term, the determination to realize investment gains or losses on fixed-maturity securities sold in any period may be subject to management’s discretion and is independent of the insurance underwriting process. Also, under applicable GAAP accounting requirements, gains and losses are recognized from certain changes in market values of securities without actual realization. Management believes that the level of investment gains or losses for any particular period, while it may be material, may not fully indicate the performance of ongoing underlying business operations in that period.
For these reasons, many investors and shareholders consider non-GAAP operating income to be one of the more meaningful measures for evaluating insurance company performance. Equity analysts who report on the insurance industry and the company generally focus on this metric in their analyses. The company presents non-GAAP operating income so that all investors have what management believes to be a useful supplement to GAAP information.
• Consolidated property casualty insurance results: To supplement reporting segment disclosures related to our property casualty insurance operations, we also evaluate results for those operations on a basis that includes results for our property casualty insurance and brokerage services subsidiaries. That is the total of our commercial lines, personal lines and our excess and surplus lines segmentsegments plus our reinsurance assumed operations.operations known as Cincinnati Re and our London-based global specialty underwriter known as Cincinnati Global.
•Life insurance subsidiary results: To supplement life insurance reporting segment disclosures related to our life insurance operation, we also evaluate results for that operation on a basis that includes life insurance subsidiary investment income, or investment income plus investment gains and losses, that are also included in our investments reporting segment. We recognize that assets under management, capital appreciation and investment income are integral to evaluating the success of the life insurance segment because of the long duration of life products.
Page 77
Cincinnati Financial Corporation
Net Income Reconciliation
| (Dollars in millions except per share data) | Twelve months ended December 31, | |||||||||||||||||||||||||
| 2020 | 2019 | |||||||||||||||||||||||||
| Net income | $ | 1,216 | $ | 1,997 | ||||||||||||||||||||||
| Less: | ||||||||||||||||||||||||||
| Investment gains and losses, net | 865 | 1,650 | ||||||||||||||||||||||||
| Income tax on investment gains and losses | (182) | (347) | ||||||||||||||||||||||||
| Investment gains and losses, after-tax | 683 | 1,303 | ||||||||||||||||||||||||
| Non-GAAP operating income | $ | 533 | $ | 694 | ||||||||||||||||||||||
| Diluted per share data: | ||||||||||||||||||||||||||
| Net income | $ | 7.49 | $ | 12.10 | ||||||||||||||||||||||
| Less: | ||||||||||||||||||||||||||
| Investment gains and losses, net | 5.33 | 10.00 | ||||||||||||||||||||||||
| Income tax on investment gains and losses | (1.12) | (2.10) | ||||||||||||||||||||||||
| Investment gains and losses, after-tax | 4.21 | 7.90 | ||||||||||||||||||||||||
| Non-GAAP operating income | $ | 3.28 | $ | 4.20 | ||||||||||||||||||||||
Page 78
| (Dollars in millions except per share data) | Twelve months ended December 31, | |||||||||||
| 2018 | 2017 | |||||||||||
| Net income (loss) | $ | 287 | $ | 1,045 | ||||||||
| Less: | ||||||||||||
| Investment gains and losses, net | (402 | ) | 148 | |||||||||
| Income tax on investment gains and losses | 84 | (53 | ) | |||||||||
| Investment gains and losses, after-tax | (318 | ) | 95 | |||||||||
| Other non-recurring items | 56 | 495 | ||||||||||
| Non-GAAP operating income | $ | 549 | $ | 455 | ||||||||
| Diluted per share data: | ||||||||||||
| Net income (loss) | $ | 1.75 | $ | 6.29 | ||||||||
| Less: | ||||||||||||
| Investment gains and losses, net | (2.44 | ) | 0.89 | |||||||||
| Income tax on investment gains and losses | 0.50 | (0.32 | ) | |||||||||
| Investment gains and losses, after-tax | (1.94 | ) | 0.57 | |||||||||
| Other non-recurring items | 0.34 | 2.98 | ||||||||||
| Non-GAAP operating income | $ | 3.35 | $ | 2.74 | ||||||||
| (Dollars in millions) | Twelve months ended December 31, | |||||||||||||||||||||||||
| 2020 | 2019 | |||||||||||||||||||||||||
| Net income of life insurance subsidiary | $ | 32 | $ | 39 | ||||||||||||||||||||||
| Investment losses, net | (27) | (4) | ||||||||||||||||||||||||
| Income tax on investment losses | (6) | — | ||||||||||||||||||||||||
| Non-GAAP operating income | 53 | 43 | ||||||||||||||||||||||||
| Investment income, net of expenses | (158) | (152) | ||||||||||||||||||||||||
| Investment income credited to contract holders' | 102 | 99 | ||||||||||||||||||||||||
| Income tax excluding tax on investment losses, net | 14 | 11 | ||||||||||||||||||||||||
| Life insurance segment profit | $ | 11 | $ | 1 | ||||||||||||||||||||||
Property Casualty Operations Reconciliation
| (Dollars in millions) | Twelve months ended December 31, 2020 | |||||||||||||||||||||||||||||||||||||||||||
| Consolidated | Commercial | Personal | E&S | Other* | ||||||||||||||||||||||||||||||||||||||||
| Premiums: | ||||||||||||||||||||||||||||||||||||||||||||
| Written premiums | $ | 5,864 | $ | 3,534 | $ | 1,503 | $ | 348 | $ | 479 | ||||||||||||||||||||||||||||||||||
| Unearned premiums change | (173) | (58) | (40) | (23) | (52) | |||||||||||||||||||||||||||||||||||||||
| Earned premiums | $ | 5,691 | $ | 3,476 | $ | 1,463 | $ | 325 | $ | 427 | ||||||||||||||||||||||||||||||||||
| Underwriting profit (loss) | $ | 119 | $ | 64 | $ | 47 | $ | 34 | $ | (26) | ||||||||||||||||||||||||||||||||||
| (Dollars in millions) | Twelve months ended December 31, 2019 | |||||||||||||||||||||||||||||||||||||||||||
| Consolidated | Commercial | Personal | E&S | Other* | ||||||||||||||||||||||||||||||||||||||||
| Premiums: | ||||||||||||||||||||||||||||||||||||||||||||
| Written premiums | $ | 5,516 | $ | 3,410 | $ | 1,435 | $ | 303 | $ | 368 | ||||||||||||||||||||||||||||||||||
| Unearned premiums change | (182) | (91) | (31) | (25) | (35) | |||||||||||||||||||||||||||||||||||||||
| Earned premiums | $ | 5,334 | $ | 3,319 | $ | 1,404 | $ | 278 | $ | 333 | ||||||||||||||||||||||||||||||||||
| Underwriting profit | $ | 341 | $ | 241 | $ | 8 | $ | 53 | $ | 39 | ||||||||||||||||||||||||||||||||||
| Dollar amounts shown are rounded to millions; certain amounts may not add due to rounding. Ratios are calculated based on dollar amounts in thousands. | ||||||||||||||||||||||||||||||||||||||||||||
| (Dollars in millions) | Twelve months ended December 31, 2018 | ||||||||||||||||||||||||
| Consolidated | Commercial | Personal | E&S | Cincinnati Re | |||||||||||||||||||||
| Premiums: | |||||||||||||||||||||||||
| Written premiums | $ | 5,030 | $ | 3,245 | $ | 1,378 | $ | 249 | $ | 158 | |||||||||||||||
| Unearned premiums change | (110 | ) | (27 | ) | (42 | ) | (15 | ) | (26 | ) | |||||||||||||||
| Earned premiums | $ | 4,920 | $ | 3,218 | $ | 1,336 | $ | 234 | $ | 132 | |||||||||||||||
| Statutory ratios: | |||||||||||||||||||||||||
| Combined ratio | 96.0 | % | 95.1 | % | 101.2 | % | 73.5 | % | 106.8 | % | |||||||||||||||
| Contribution from catastrophe losses | 7.1 | 5.8 | 9.4 | 1.1 | 24.9 | ||||||||||||||||||||
| Combined ratio excluding catastrophe losses | 88.9 | % | 89.3 | % | 91.8 | % | 72.4 | % | 81.9 | % | |||||||||||||||
| Commission expense ratio | 18.8 | % | 18.3 | % | 17.8 | % | 25.9 | % | 26.2 | % | |||||||||||||||
| Other underwriting expense ratio | 11.7 | 13.1 | 10.6 | 3.2 | 6.6 | ||||||||||||||||||||
| Total expense ratio | 30.5 | % | 31.4 | % | 28.4 | % | 29.1 | % | 32.8 | % | |||||||||||||||
| GAAP ratios: | |||||||||||||||||||||||||
| Combined ratio | 96.4 | % | 95.4 | % | 101.9 | % | 73.5 | % | 105.8 | % | |||||||||||||||
| Contribution from catastrophe losses | 7.1 | 5.8 | 9.4 | 1.1 | 24.9 | ||||||||||||||||||||
| Prior accident years before catastrophe losses | (3.1 | ) | (4.2 | ) | 0.6 | (10.6 | ) | 1.1 | |||||||||||||||||
Current accident year combined ratio before catastrophe losses | 92.4 | % | 93.8 | % | 91.9 | % | 83.0 | % | 79.8 | % | |||||||||||||||
| Dollar amounts shown are rounded to millions; certain amounts may not add due to rounding. Ratios are calculated based on dollar amounts in thousands. | |||||||||||||||||||||||||
Page 79
| (Dollars in millions) | Twelve months ended December 31, | |||||||||||
| 2018 | 2017 | |||||||||||
| Net income of life insurance subsidiary | $ | 48 | $ | 155 | ||||||||
| Investment gains, net | (4 | ) | 6 | |||||||||
| Income tax on investment gains | — | 2 | ||||||||||
| Effects of U.S. tax reform legislation | — | 111 | ||||||||||
| Non-GAAP operating income | 52 | 40 | ||||||||||
| Investment income, net of expenses | (153 | ) | (155 | ) | ||||||||
| Investment income credited to contract holders' | 96 | 93 | ||||||||||
| Income tax excluding tax on investment gains and effects of U.S. tax reform legislation | 13 | 21 | ||||||||||
| Life insurance segment profit (loss) | $ | 8 | $ | (1 | ) | |||||||
Other Measures
•Value creation ratio: This is a measure of shareholder value creation that management believes captures the contribution of the company’s insurance operations, the success of its investment strategy and the importance placed on paying cash dividends to shareholders. The value creation ratio measure is made up of two primary components: (1) rate of growth in book value per share plus (2) the ratio of dividends declared per share to beginning book value per share. Management believes this measure is useful, providing a meaningful measure of long-term progress in creating shareholder value. It is intended to be all-inclusive regarding changes in book value per share, and uses originally reported book value per share in cases where book value per share has been adjusted, such as adoption of Accounting Standards Updates with a cumulative effect of a change in accounting.
• Written premium: Under statutory accounting rules in the U.S., property casualty written premium is the amount recorded for policies issued and recognized on an annualized basis at the effective date of the policy. Management analyzes trends in written premium to assess business efforts. Earned premium, used in both statutory and GAAP accounting, is calculated ratably over the policy term. The difference between written and earned premium is unearned premium.
Cincinnati Financial Corporation
Value Creation Ratio Calculations
| (Dollars are per share) | Twelve months ended December 31, | |||||||||||||||||||||||||
| 2020 | 2019 | |||||||||||||||||||||||||
| Value creation ratio: | ||||||||||||||||||||||||||
| End of period book value* | $ | 67.04 | $ | 60.55 | ||||||||||||||||||||||
| Less beginning of period book value | 60.55 | 48.10 | ||||||||||||||||||||||||
| Change in book value | 6.49 | 12.45 | ||||||||||||||||||||||||
| Dividend declared to shareholders | 2.40 | 2.24 | ||||||||||||||||||||||||
| Total value creation | $ | 8.89 | $ | 14.69 | ||||||||||||||||||||||
| Value creation ratio from change in book value** | 10.7 | % | 25.9 | % | ||||||||||||||||||||||
| Value creation ratio from dividends declared to shareholders*** | 4.0 | 4.6 | ||||||||||||||||||||||||
| Value creation ratio | 14.7 | % | 30.5 | % | ||||||||||||||||||||||
| * Book value per share is calculated by dividing end of period total shareholders’ equity by end of period shares outstanding | ||||||||||||||||||||||||||
| ** Change in book value divided by the beginning of period book value | ||||||||||||||||||||||||||
| *** Dividend declared to shareholders divided by beginning of period book value | ||||||||||||||||||||||||||
Page 80
| (Dollars are per share) | Twelve months ended December 31, | |||||||||||
| 2018 | 2017 | |||||||||||
| Value creation ratio: | ||||||||||||
| End of period book value* | $ | 48.10 | $ | 50.29 | ||||||||
| Less beginning of period book value | 50.29 | 42.95 | ||||||||||
| Change in book value | (2.19 | ) | 7.34 | |||||||||
| Dividend declared to shareholders | 2.12 | 2.50 | ||||||||||
| Total value creation | $ | (0.07 | ) | $ | 9.84 | |||||||
| Value creation ratio from change in book value** | (4.3 | )% | 17.1 | % | ||||||||
Value creation ratio from dividends declared to shareholders*** | 4.2 | 5.8 | ||||||||||
| Value creation ratio | (0.1 | )% | 22.9 | % | ||||||||
| * Book value per share is calculated by dividing end of period total shareholders’ equity by end of period shares outstanding | ||||||||||||
| ** Change in book value divided by the beginning of period book value | ||||||||||||
| *** Dividend declared to shareholders divided by beginning of period book value | ||||||||||||
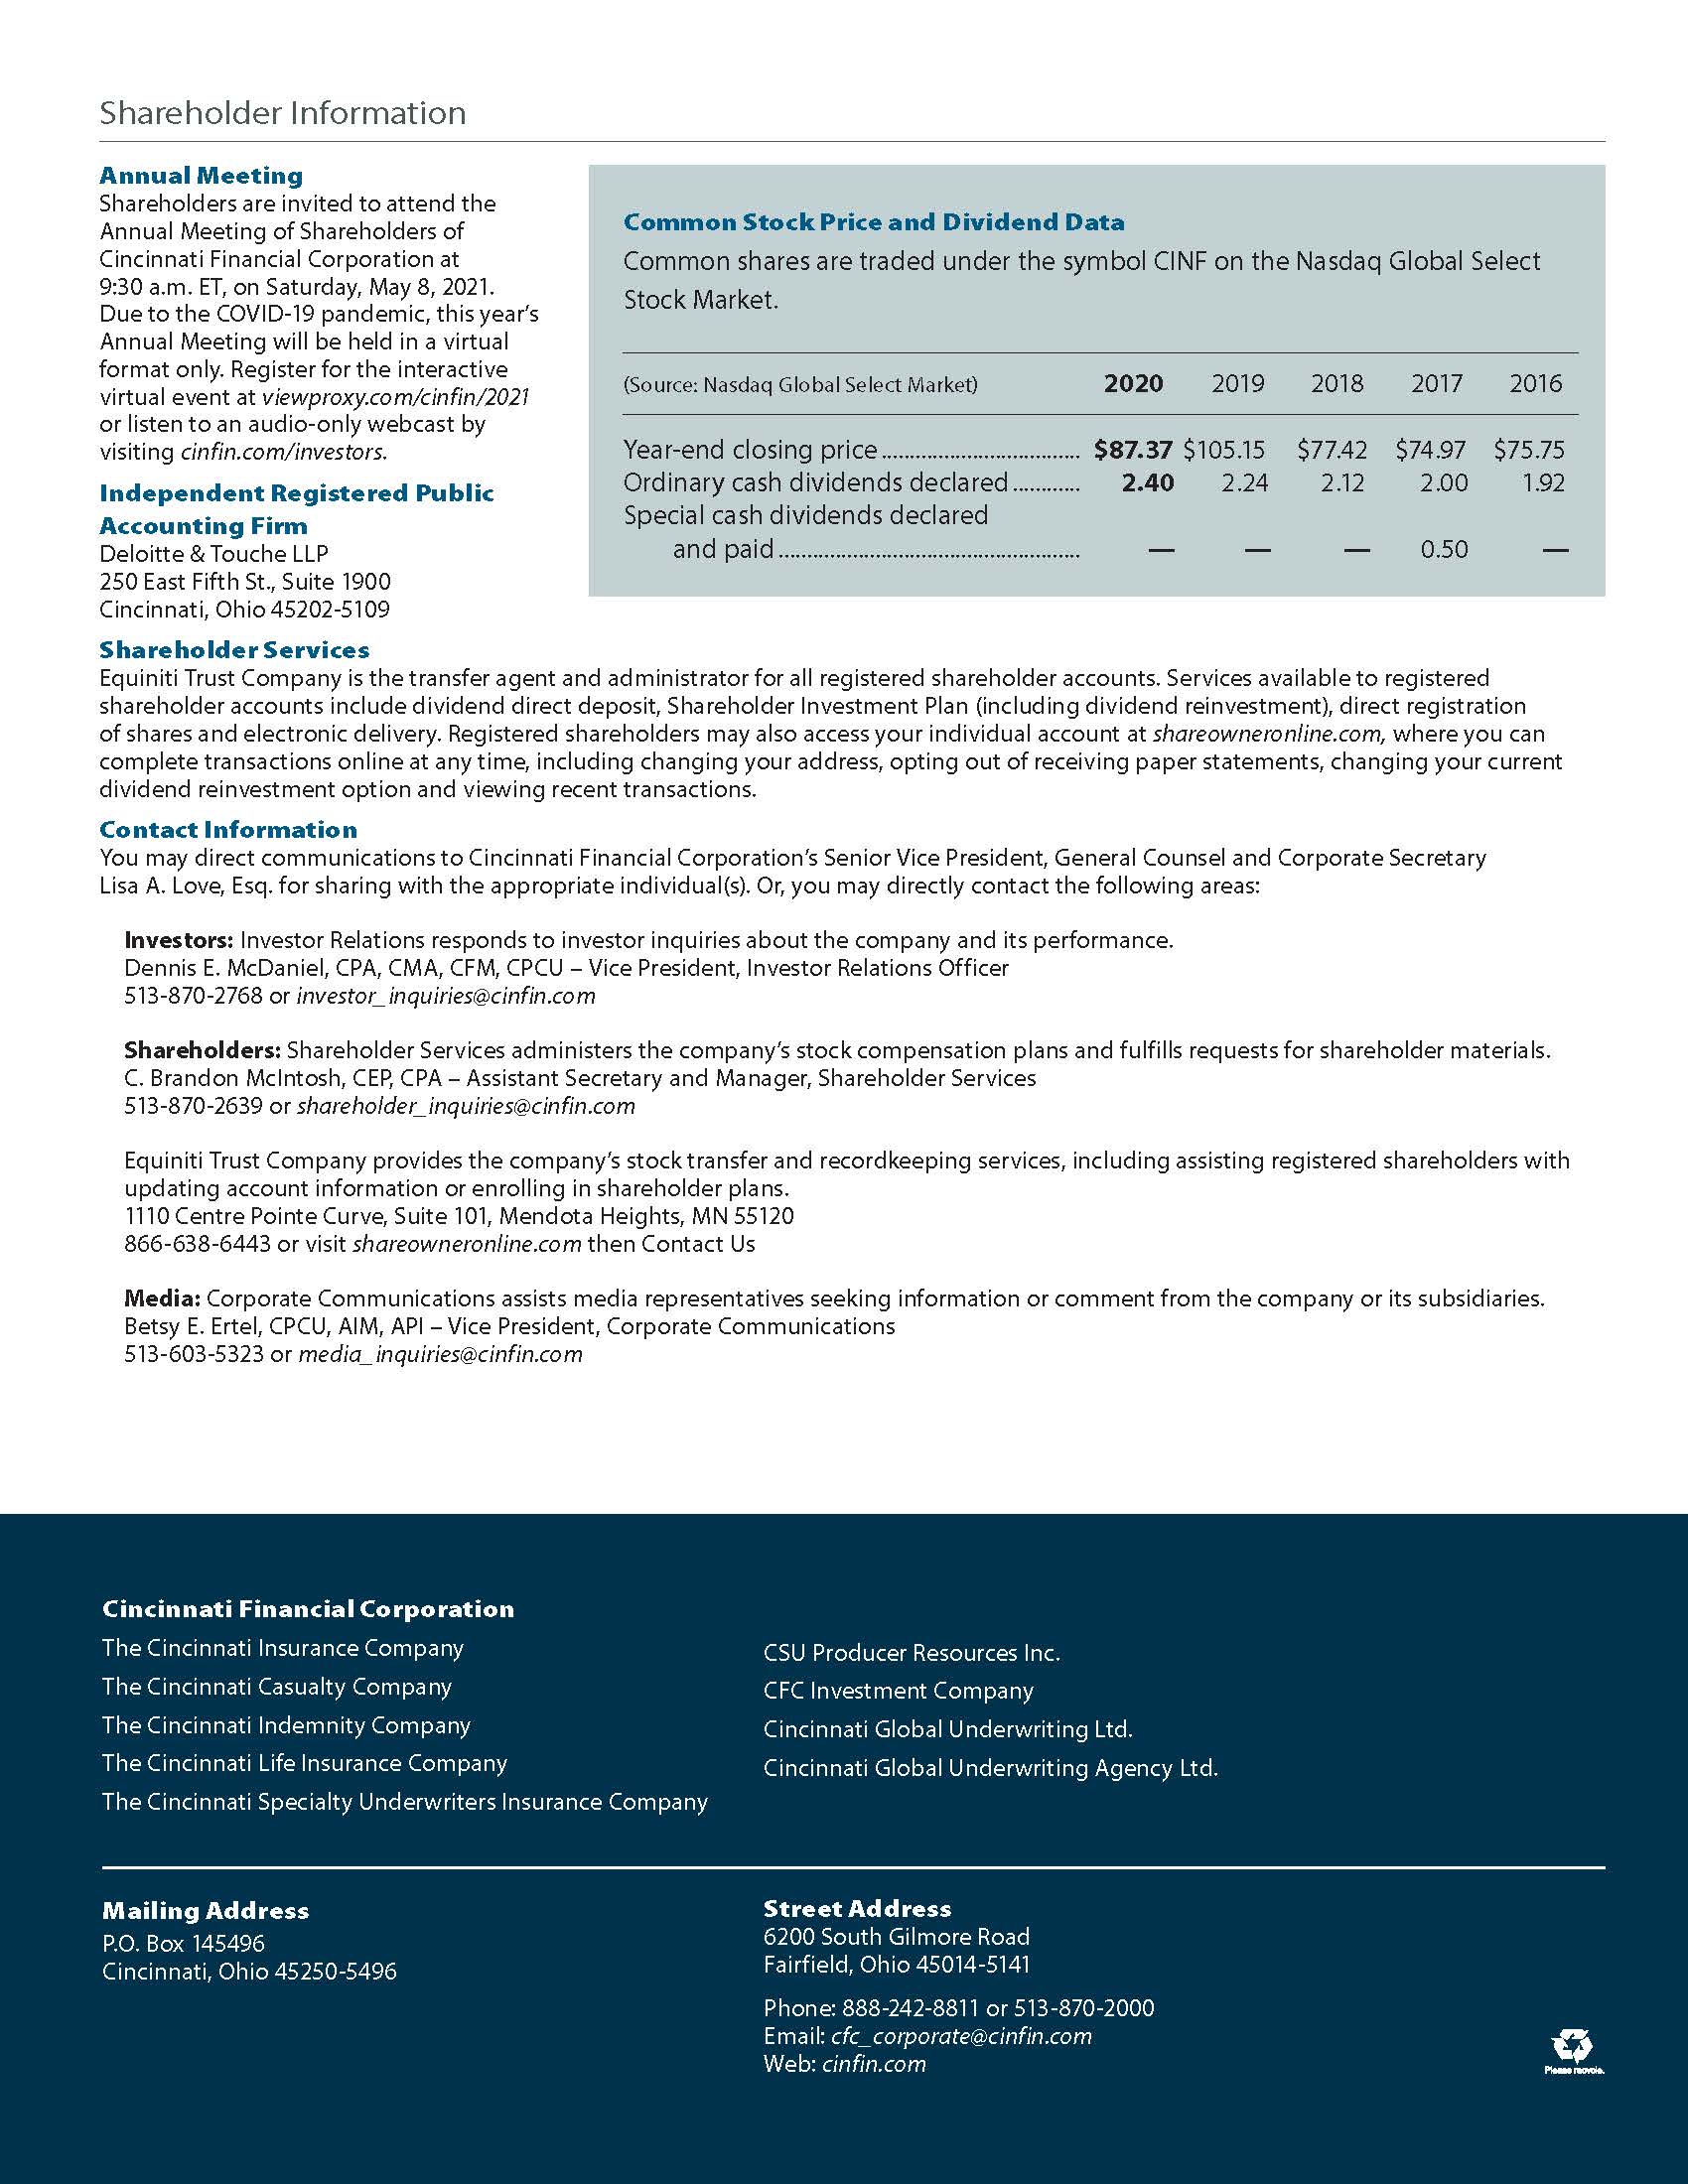
Page 81